GDP of United States
| GDP nominal (2017) | GDP growth rate (2017) |
|---|---|
$19,485,394,000,000 |
2.27% |
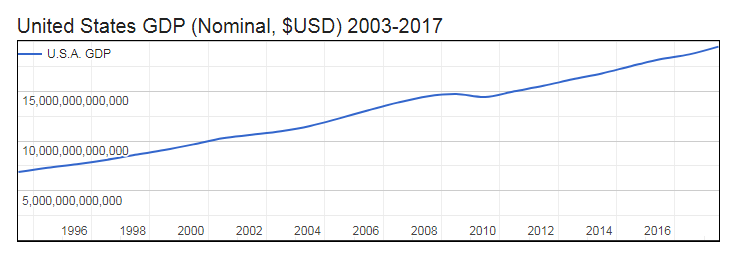
- Nominal (current) Gross Domestic Product GDP of United States is $19,485,394,000,000 (USD) as of 2017.
- Real GDP (constant, inflation adjusted) of the United States of America reached $17,348,625,758,200 in 2017.
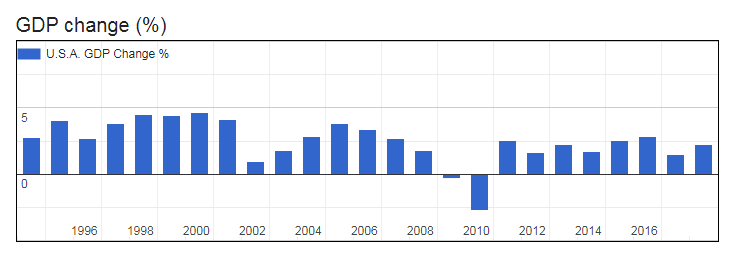
- GDP Growth Rate in 2017 was 2.27%, representing a change of 376,278,687,800 US$ over 2016, when Real GDP was $16,972,347,070,400.
- GDP per Capita in the United States of America (with a population of 325,084,756 people) was $53,366 in 2017, an increase of $823 from $52,543 in 2016; this represents a change of 1.6% in GDP per capita.
United States Gross Domestic Product GDP of United States
| Year | GDP Nominal (Current USD) |
GDP Real (Inflation adj.) |
GDP change |
GDP per capita | Pop. change |
Population |
|---|---|---|---|---|---|---|
| 2017 | $19,485,394,000,000 | $17,348,625,758,200 | 2.27% | $53,366 | 0.64 % | 325,084,756 |
| 2016 | $18,707,189,000,000 | $16,972,347,070,400 | 1.49% | $52,543 | 0.67 % | 323,015,995 |
| 2015 | $18,219,297,000,000 | $16,710,458,234,000 | 2.86% | $52,077 | 0.69 % | 320,878,310 |
| 2014 | $17,521,747,000,000 | $16,242,525,613,600 | 2.57% | $50,969 | 0.72 % | 318,673,411 |
| 2013 | $16,784,851,000,000 | $15,853,794,839,100 | 1.68% | $50,107 | 0.75 % | 316,400,538 |
| 2012 | $16,197,007,000,000 | $15,567,037,390,000 | 2.22% | $49,570 | 0.79 % | 314,043,885 |
| 2011 | $15,542,582,000,000 | $15,224,554,065,500 | 1.60% | $48,862 | 0.83 % | 311,584,047 |
| 2010 | $14,992,052,000,000 | $14,992,052,000,000 | 2.53% | $48,516 | 0.88 % | 309,011,475 |
| 2009 | $14,418,739,000,000 | $14,594,842,181,900 | -2.78% | $47,648 | 0.93 % | 306,307,567 |
| 2008 | $14,718,582,000,000 | $15,011,490,541,400 | -0.29% | $49,464 | 0.96 % | 303,486,012 |
| 2007 | $14,477,635,000,000 | $15,055,395,304,800 | 1.78% | $50,083 | 0.96 % | 300,608,429 |
| 2006 | $13,855,888,000,000 | $14,792,303,791,800 | 2.67% | $49,679 | 0.94 % | 297,758,969 |
| 2005 | $13,093,726,000,000 | $14,408,093,840,400 | 3.35% | $48,842 | 0.90 % | 294,993,511 |
| 2004 | $12,274,928,000,000 | $13,941,713,404,100 | 3.79% | $47,688 | 0.88 % | 292,354,658 |
| 2003 | $11,510,670,000,000 | $13,433,168,199,500 | 2.81% | $46,351 | 0.88 % | 289,815,562 |
| 2002 | $10,977,514,000,000 | $13,066,422,980,900 | 1.79% | $45,483 | 0.94 % | 287,279,318 |
| 2001 | $10,621,824,000,000 | $12,837,135,352,100 | 0.98% | $45,105 | 1.03 % | 284,607,993 |
| 2000 | $10,284,779,000,000 | $12,713,058,213,400 | 4.09% | $45,128 | 1.14 % | 281,710,909 |
| 1999 | $9,660,624,000,000 | $12,213,269,668,400 | 4.69% | $43,846 | 1.23 % | 278,548,150 |
| 1998 | $9,089,168,000,000 | $11,666,663,209,400 | 4.45% | $42,397 | 1.27 % | 275,175,301 |
| 1997 | $8,608,515,000,000 | $11,169,624,848,700 | 4.49% | $41,108 | 1.26 % | 271,713,635 |
| 1996 | $8,100,201,000,000 | $10,689,963,360,600 | 3.80% | $39,838 | 1.20 % | 268,335,003 |
| 1995 | $7,664,060,000,000 | $10,299,024,618,300 | 2.72% | $38,840 | 1.11 % | 265,163,745 |
| 1994 | $7,308,755,000,000 | $10,026,408,985,500 | 4.04% | $38,234 | 1.04 % | 262,241,196 |