GDP of Aruba
| GDP nominal (2017) | GDP growth rate (2017) |
|---|---|
$2,700,558,659 |
1.33% |
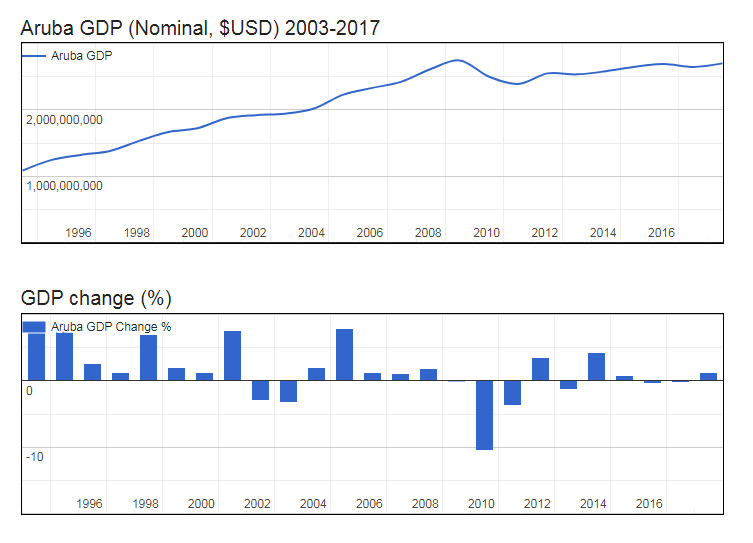
- Nominal (current) Gross Domestic Product (GDP of Aruba is $2,700,558,659 (USD) as of 2017.
- Real GDP (constant, inflation adjusted) of Aruba reached $2,579,895,285 in 2017.
- GDP Growth Rate in 2017 was 1.33%, representing a change of 33,875,080 US$ over 2016, when Real GDP was $2,546,020,205.
- GDP per Capita in Aruba (with a population of 105,366 people) was $24,485 in 2017, an increase of $208 from $24,277 in 2016; this represents a change of 0.9% in GDP per capita.
Gross Domestic Product (GDP) of Aruba
| Year | GDP Nominal (Current USD) |
GDP Real (Inflation adj.) |
GDP change |
GDP per capita | Pop. change |
Population |
|---|---|---|---|---|---|---|
| 2017 | $2,700,558,659 | $2,579,895,285 | 1.33% | $24,485 | 0.47 % | 105,366 |
| 2016 | $2,646,927,374 | $2,546,020,205 | -0.21% | $24,277 | 0.51 % | 104,872 |
| 2015 | $2,691,620,112 | $2,551,409,423 | -0.45% | $24,453 | 0.55 % | 104,341 |
| 2014 | $2,649,720,670 | $2,562,957,745 | 0.85% | $24,697 | 0.60 % | 103,774 |
| 2013 | $2,581,564,246 | $2,541,400,876 | 4.20% | $24,636 | 0.58 % | 103,159 |
| 2012 | $2,534,636,872 | $2,439,005,749 | -1.37% | $23,781 | 0.50 % | 102,560 |
| 2011 | $2,549,720,670 | $2,472,880,828 | 3.45% | $24,233 | 0.37 % | 102,046 |
| 2010 | $2,390,502,793 | $2,390,502,793 | -3.69% | $23,513 | 0.21 % | 101,669 |
| 2009 | $2,498,882,682 | $2,481,963,897 | -10.52% | $24,464 | 0.10 % | 101,455 |
| 2008 | $2,745,251,397 | $2,773,756,031 | -0.09% | $27,366 | 0.13 % | 101,358 |
| 2007 | $2,615,083,799 | $2,776,274,327 | 1.80% | $27,428 | 0.38 % | 101,222 |
| 2006 | $2,424,581,006 | $2,727,178,946 | 1.05% | $27,046 | 0.80 % | 100,834 |
| 2005 | $2,330,726,257 | $2,698,824,913 | 1.21% | $26,980 | 1.31 % | 100,031 |
| 2004 | $2,228,491,620 | $2,666,444,969 | 7.91% | $27,006 | 1.77 % | 98,737 |
| 2003 | $2,021,229,050 | $2,470,953,857 | 1.98% | $25,469 | 2.13 % | 97,017 |
| 2002 | $1,941,340,782 | $2,423,084,673 | -3.27% | $25,508 | 2.25 % | 94,992 |
| 2001 | $1,920,111,732 | $2,505,092,558 | -2.97% | $26,966 | 2.25 % | 92,898 |
| 2000 | $1,873,452,514 | $2,581,804,608 | 7.62% | $28,417 | 2.08 % | 90,853 |
| 1999 | $1,722,798,883 | $2,399,076,773 | 1.24% | $26,954 | 1.98 % | 89,005 |
| 1998 | $1,665,100,559 | $2,369,738,480 | 1.99% | $27,152 | 2.14 % | 87,277 |
| 1997 | $1,531,944,134 | $2,323,455,517 | 7.05% | $27,191 | 2.71 % | 85,451 |
| 1996 | $1,379,960,894 | $2,170,502,948 | 1.19% | $26,088 | 3.58 % | 83,200 |
| 1995 | $1,320,474,860 | $2,145,066,958 | 2.55% | $26,705 | 4.72 % | 80,324 |
| 1994 | $1,245,688,253 | $2,091,786,180 | 8.20% | $27,272 | 5.79 % | 76,700 |