GDP of Australia
| GDP nominal (2017) | GDP growth rate (2017) |
|---|---|
$1,323,421,072,479 |
1.96% |
- Nominal (current) Gross Domestic Product (GDP of Australia is $1,323,421,072,479 (USD) as of 2017.
- Real GDP (constant, inflation adjusted) of Australia reached $1,375,718,249,724 in 2017.
- GDP Growth Rate in 2017 was 1.96%, representing a change of 26,413,655,107 US$ over 2016, when Real GDP was $1,349,304,594,617.
- GDP per Capita in Australia (with a population of 24,584,620 people) was $55,958 in 2017, an increase of $346 from $55,612 in 2016; this represents a change of 0.6% in GDP per capita.

Australia Gross Domestic Product (GDP of Australia
| Year | GDP Nominal (Current USD) |
GDP Real (Inflation adj.) |
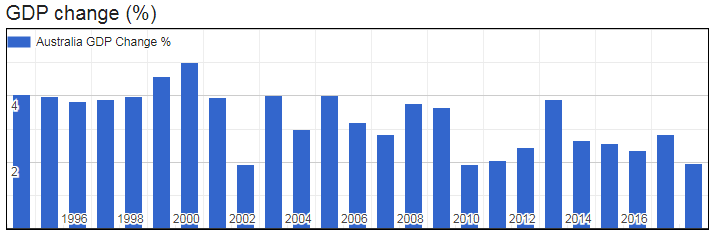
GDP change |
GDP per capita | Pop. change |
Population |
|---|---|---|---|---|---|---|
| 2017 | $1,323,421,072,479 | $1,375,718,249,724 | 1.96% | $55,958 | 1.33 % | 24,584,620 |
| 2016 | $1,208,039,015,868 | $1,349,304,594,617 | 2.83% | $55,612 | 1.38 % | 24,262,712 |
| 2015 | $1,349,034,029,453 | $1,312,204,498,895 | 2.35% | $54,829 | 1.42 % | 23,932,502 |
| 2014 | $1,464,955,475,994 | $1,282,061,484,148 | 2.56% | $54,333 | 1.47 % | 23,596,424 |
| 2013 | $1,573,696,522,007 | $1,250,080,212,993 | 2.64% | $53,756 | 1.53 % | 23,254,913 |
| 2012 | $1,543,411,012,580 | $1,217,933,084,117 | 3.89% | $53,176 | 1.62 % | 22,903,948 |
| 2011 | $1,394,280,784,778 | $1,172,307,576,321 | 2.45% | $52,015 | 1.73 % | 22,538,001 |
| 2010 | $1,144,260,547,873 | $1,144,260,547,873 | 2.05% | $51,649 | 1.86 % | 22,154,679 |
| 2009 | $926,448,240,318 | $1,121,242,097,879 | 1.92% | $51,549 | 1.96 % | 21,750,851 |
| 2008 | $1,052,584,601,611 | $1,100,090,360,276 | 3.66% | $51,569 | 1.99 % | 21,332,282 |
| 2007 | $851,962,785,585 | $1,061,271,523,268 | 3.78% | $50,739 | 1.90 % | 20,916,344 |
| 2006 | $745,521,862,833 | $1,022,642,934,821 | 2.83% | $49,821 | 1.72 % | 20,526,303 |
| 2005 | $692,641,708,014 | $994,457,691,606 | 3.19% | $49,283 | 1.50 % | 20,178,540 |
| 2004 | $611,904,253,806 | $963,712,223,078 | 4.00% | $48,477 | 1.30 % | 19,879,649 |
| 2003 | $466,294,700,058 | $926,636,518,197 | 2.99% | $47,219 | 1.15 % | 19,624,166 |
| 2002 | $394,486,709,920 | $899,771,632,526 | 4.00% | $46,377 | 1.08 % | 19,401,368 |
| 2001 | $378,215,090,694 | $865,139,889,946 | 1.93% | $45,072 | 1.07 % | 19,194,672 |
| 2000 | $415,034,227,218 | $848,732,984,010 | 3.94% | $44,690 | 1.08 % | 18,991,431 |
| 1999 | $388,395,162,301 | $816,535,447,395 | 5.02% | $43,460 | 1.08 % | 18,788,186 |
| 1998 | $398,899,138,574 | $777,519,044,572 | 4.58% | $41,831 | 1.09 % | 18,587,021 |
| 1997 | $434,568,007,513 | $743,491,381,829 | 3.97% | $40,435 | 1.09 % | 18,387,214 |
| 1996 | $400,302,731,411 | $715,126,459,416 | 3.88% | $39,316 | 1.09 % | 18,189,277 |
| 1995 | $367,216,364,716 | $688,424,992,381 | 3.83% | $38,261 | 1.09 % | 17,993,074 |
| 1994 | $322,201,314,424 | $663,034,939,582 | 3.98% | $37,252 | 1.11 % | 17,798,529 |