GDP of Brunei
| GDP nominal (2017) | GDP growth rate (2017) |
|---|---|
$12,128,089,002 |
1.33% |
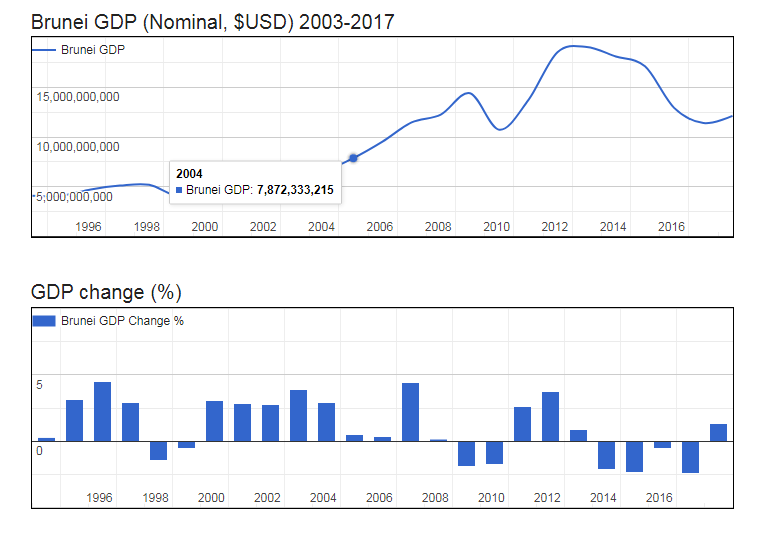
- Nominal (current) Gross Domestic Product GDP of Brunei Darussalam is $12,128,089,002 (USD) as of 2017.
- Real GDP (constant, inflation adjusted) of Negara Brunei Darussalam reached $13,478,200,979 in 2017.
- GDP Growth Rate in 2017 was 1.33%, representing a change of 176,743,333 US$ over 2016, when Real GDP was $13,301,457,646.
- GDP per Capita in Negara Brunei Darussalam (with a population of 424,473 people) was $31,753 in 2017, an increase of $68 from $31,685 in 2016; this represents a change of 0.2% in GDP per capita.
Gross Domestic Product : GDP of Brunei Darussalam
| Year | GDP Nominal (Current USD) |
GDP Real (Inflation adj.) |
GDP change |
GDP per capita | Pop. change |
Population |
|---|---|---|---|---|---|---|
| 2017 | $12,128,089,002 | $13,478,200,979 | 1.33% | $31,753 | 1.11 % | 424,473 |
| 2016 | $11,400,653,949 | $13,301,457,646 | -2.47% | $31,685 | 1.18 % | 419,800 |
| 2015 | $12,930,394,938 | $13,637,697,103 | -0.57% | $32,869 | 1.25 % | 414,907 |
| 2014 | $17,098,342,541 | $13,715,438,210 | -2.35% | $33,471 | 1.32 % | 409,769 |
| 2013 | $18,093,829,923 | $14,045,471,214 | -2.13% | $34,730 | 1.36 % | 404,421 |
| 2012 | $19,048,495,519 | $14,350,568,390 | 0.91% | $35,967 | 1.35 % | 398,989 |
| 2011 | $18,525,319,978 | $14,220,755,409 | 3.75% | $36,122 | 1.30 % | 393,688 |
| 2010 | $13,707,370,737 | $13,707,370,737 | 2.60% | $35,270 | 1.23 % | 388,646 |
| 2009 | $10,732,366,286 | $13,360,145,141 | -1.76% | $34,801 | 1.18 % | 383,906 |
| 2008 | $14,393,099,069 | $13,600,124,166 | -1.94% | $35,844 | 1.19 % | 379,421 |
| 2007 | $12,247,694,247 | $13,869,146,021 | 0.15% | $36,988 | 1.27 % | 374,965 |
| 2006 | $11,470,703,002 | $13,847,739,934 | 4.40% | $37,400 | 1.41 % | 370,263 |
| 2005 | $9,531,402,848 | $13,264,408,434 | 0.39% | $36,329 | 1.58 % | 365,114 |
| 2004 | $7,872,333,215 | $13,213,206,307 | 0.50% | $36,761 | 1.74 % | 359,433 |
| 2003 | $6,557,333,085 | $13,146,904,070 | 2.90% | $37,212 | 1.88 % | 353,293 |
| 2002 | $5,843,329,108 | $12,775,897,690 | 3.87% | $36,841 | 1.98 % | 346,782 |
| 2001 | $5,601,090,584 | $12,299,643,564 | 2.74% | $36,172 | 2.06 % | 340,034 |
| 2000 | $6,001,153,306 | $11,971,150,348 | 2.85% | $35,932 | 2.13 % | 333,165 |
| 1999 | $4,600,000,000 | $11,639,492,116 | 3.05% | $35,681 | 2.21 % | 326,210 |
| 1998 | $4,051,147,228 | $11,294,758,343 | -0.56% | $35,391 | 2.30 % | 319,144 |
| 1997 | $5,197,332,974 | $11,358,194,866 | -1.47% | $36,409 | 2.41 % | 311,958 |
| 1996 | $5,115,602,837 | $11,527,788,412 | 2.88% | $37,843 | 2.53 % | 304,622 |
| 1995 | $4,734,020,037 | $11,205,265,273 | 4.48% | $37,714 | 2.65 % | 297,114 |
| 1994 | $4,087,337,960 | $10,724,927,173 | 3.15% | $37,052 | 2.76 % | 289,454 |