GDP of Egypt
| GDP nominal (2017) | GDP growth rate (2017) |
|---|---|
$235,369,129,338 |
4.18% |
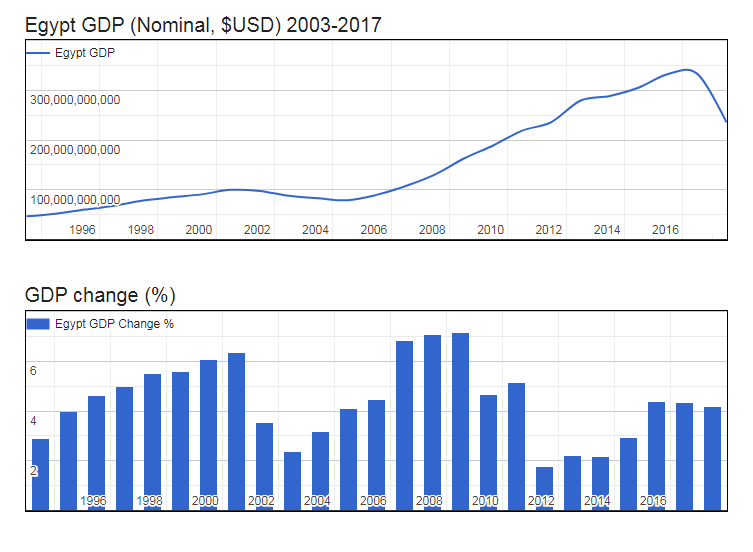
- Nominal (current) Gross Domestic Product (GDP of Egypt is $235,369,129,338 (USD) as of 2017.
- Real GDP (constant, inflation adjusted) of Egypt reached $271,709,667,876 in 2017.
- GDP Growth Rate in 2017 was 4.18%, representing a change of 10,904,826,784 US$ over 2016, when Real GDP was $260,804,841,092.
- GDP per Capita in Egypt (with a population of 96,442,591 people) was $2,817 in 2017, an increase of $56 from $2,761 in 2016; this represents a change of 2.0% in GDP per capita.
Gross Domestic Product (GDP of Egypt
| Year | GDP Nominal (Current USD) |
GDP Real (Inflation adj.) |
GDP change |
GDP per capita | Pop. change |
Population |
|---|---|---|---|---|---|---|
| 2017 | $235,369,129,338 | $271,709,667,876 | 4.18% | $2,817 | 2.11 % | 96,442,591 |
| 2016 | $332,927,833,278 | $260,804,841,092 | 4.35% | $2,761 | 2.17 % | 94,447,073 |
| 2015 | $332,698,041,031 | $249,940,805,430 | 4.37% | $2,704 | 2.23 % | 92,442,547 |
| 2014 | $305,529,656,458 | $239,471,083,953 | 2.92% | $2,648 | 2.28 % | 90,424,656 |
| 2013 | $288,586,231,502 | $232,686,160,555 | 2.19% | $2,632 | 2.29 % | 88,404,646 |
| 2012 | $279,372,758,362 | $227,709,643,593 | 2.23% | $2,635 | 2.24 % | 86,422,243 |
| 2011 | $236,001,858,960 | $222,750,766,481 | 1.76% | $2,635 | 2.14 % | 84,529,252 |
| 2010 | $218,888,324,505 | $218,888,324,505 | 5.15% | $2,645 | 2.00 % | 82,761,235 |
| 2009 | $188,982,374,701 | $208,173,162,898 | 4.67% | $2,566 | 1.88 % | 81,134,798 |
| 2008 | $162,818,181,818 | $198,878,383,180 | 7.16% | $2,497 | 1.79 % | 79,636,079 |
| 2007 | $130,478,960,092 | $185,596,566,593 | 7.09% | $2,372 | 1.77 % | 78,232,126 |
| 2006 | $107,484,034,871 | $173,312,477,288 | 6.84% | $2,255 | 1.79 % | 76,873,663 |
| 2005 | $89,685,725,230 | $162,211,017,699 | 4.47% | $2,148 | 1.82 % | 75,523,569 |
| 2004 | $78,845,185,293 | $155,267,836,792 | 4.09% | $2,093 | 1.85 % | 74,172,073 |
| 2003 | $82,924,503,943 | $149,163,941,486 | 3.19% | $2,048 | 1.88 % | 72,826,097 |
| 2002 | $87,850,683,979 | $144,547,870,670 | 2.39% | $2,022 | 1.90 % | 71,485,043 |
| 2001 | $97,632,008,710 | $141,173,535,145 | 3.54% | $2,012 | 1.92 % | 70,152,661 |
| 2000 | $99,838,543,960 | $136,353,109,167 | 6.37% | $1,981 | 1.95 % | 68,831,561 |
| 1999 | $90,710,704,807 | $128,187,556,882 | 6.05% | $1,899 | 1.99 % | 67,515,591 |
| 1998 | $84,828,807,556 | $120,870,721,732 | 5.58% | $1,826 | 2.02 % | 66,200,269 |
| 1997 | $78,436,578,171 | $114,487,475,439 | 5.49% | $1,764 | 2.03 % | 64,892,270 |
| 1996 | $67,629,716,981 | $108,526,798,676 | 4.99% | $1,706 | 2.03 % | 63,601,629 |
| 1995 | $60,159,245,060 | $103,369,950,361 | 4.64% | $1,658 | 2.03 % | 62,334,034 |
| 1994 | $51,897,983,393 | $98,783,946,369 | 3.97% | $1,617 | 2.03 % | 61,095,804 |