GDP of Germany
| GDP nominal (2017) | GDP growth rate (2017) |
|---|---|
$3,693,204,332,230 |
2.22% |
- Nominal (current) Gross Domestic Product GDP of Germany is $3,693,204,332,230 (USD) as of 2017.
- Real GDP (constant, inflation adjusted) of Germany reached $3,883,869,685,204 in 2017.
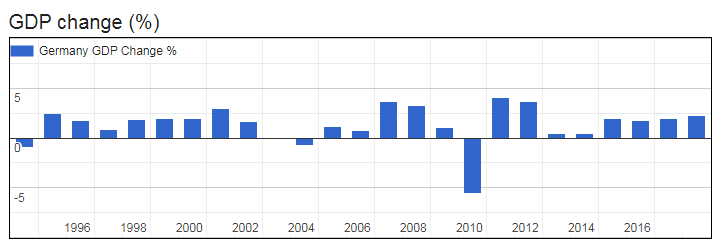
- GDP Growth Rate in 2017 was 2.22%, representing a change of 82,010,269,503 US$ over 2016, when Real GDP was $3,801,859,415,701.
- GDP per Capita in Germany (with a population of 82,658,409 people) was $46,987 in 2017, an increase of $732 from $46,255 in 2016; this represents a change of 1.6% in GDP per capita.

Germany Gross Domestic Product GDP of Germany
| Year | GDP Nominal (Current USD) |
GDP Real (Inflation adj.) |
GDP change |
GDP per capita | Pop. change |
Population |
|---|---|---|---|---|---|---|
| 2017 | $3,693,204,332,230 | $3,883,869,685,204 | 2.22% | $46,987 | 0.57 % | 82,658,409 |
| 2016 | $3,495,162,856,297 | $3,801,859,415,701 | 1.94% | $46,255 | 0.50 % | 82,193,768 |
| 2015 | $3,381,389,338,659 | $3,718,482,300,426 | 1.74% | $45,465 | 0.41 % | 81,787,411 |
| 2014 | $3,898,726,503,841 | $3,654,924,349,507 | 1.93% | $44,873 | 0.34 % | 81,450,378 |
| 2013 | $3,752,513,503,278 | $3,577,014,590,830 | 0.49% | $44,066 | 0.25 % | 81,174,367 |
| 2012 | $3,543,983,909,148 | $3,559,587,403,263 | 0.49% | $43,960 | 0.14 % | 80,972,628 |
| 2011 | $3,757,698,281,118 | $3,542,160,228,940 | 3.66% | $43,808 | 0.04 % | 80,855,632 |
| 2010 | $3,417,094,562,649 | $3,417,094,562,649 | 4.08% | $42,277 | -0.09 % | 80,827,002 |
| 2009 | $3,418,005,001,389 | $3,283,144,458,442 | -5.62% | $40,583 | -0.20 % | 80,899,961 |
| 2008 | $3,752,365,607,148 | $3,478,602,264,777 | 1.08% | $42,911 | -0.26 % | 81,065,752 |
| 2007 | $3,439,953,462,907 | $3,441,355,939,341 | 3.26% | $42,341 | -0.24 % | 81,277,830 |
| 2006 | $3,002,446,368,084 | $3,332,692,329,600 | 3.70% | $40,906 | -0.16 % | 81,472,226 |
| 2005 | $2,861,410,272,354 | $3,213,777,436,171 | 0.71% | $39,383 | -0.05 % | 81,602,741 |
| 2004 | $2,819,245,095,605 | $3,191,224,606,760 | 1.17% | $39,086 | 0.04 % | 81,646,474 |
| 2003 | $2,505,733,634,312 | $3,154,319,996,079 | -0.71% | $38,649 | 0.10 % | 81,614,380 |
| 2002 | $2,079,136,081,310 | $3,176,872,812,246 | 0.00% | $38,963 | 0.10 % | 81,535,122 |
| 2001 | $1,950,648,769,575 | $3,176,872,812,246 | 1.70% | $39,002 | 0.07 % | 81,453,885 |
| 2000 | $1,949,953,934,034 | $3,123,907,846,525 | 2.96% | $38,377 | 0.01 % | 81,400,882 |
| 1999 | $2,199,957,383,337 | $3,034,038,256,878 | 1.99% | $37,278 | -0.02 % | 81,389,927 |
| 1998 | $2,243,225,519,618 | $2,974,922,531,540 | 1.98% | $36,546 | 0.00 % | 81,402,673 |
| 1997 | $2,218,689,375,141 | $2,917,173,625,485 | 1.85% | $35,838 | 0.09 % | 81,399,251 |
| 1996 | $2,503,665,193,657 | $2,864,208,659,764 | 0.82% | $35,220 | 0.23 % | 81,323,664 |
| 1995 | $2,591,620,035,485 | $2,840,972,414,089 | 1.74% | $35,014 | 0.38 % | 81,138,659 |
| 1994 | $2,205,966,011,812 | $2,792,449,673,948 | 2.46% | $34,546 | 0.50 % | 80,832,937 |