GDP of Guinea
| GDP nominal (2017) | GDP growth rate (2017) |
|---|---|
$10,472,514,515 |
10.60% |
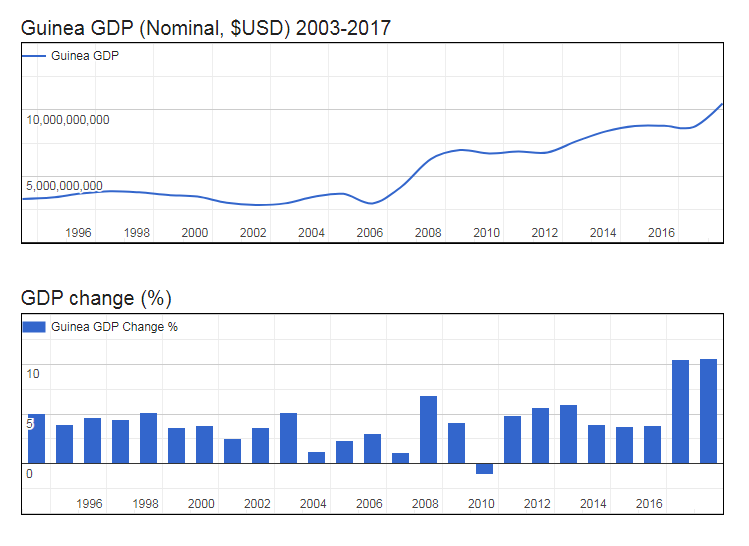
- Nominal (current) Gross Domestic Product : GDP of Guinea is $10,472,514,515 (USD) as of 2017.
- Real GDP (constant, inflation adjusted) of Guinea reached $10,480,310,146 in 2017.
- GDP Growth Rate in 2017 was 10.60%, representing a change of 1,004,812,374 US$ over 2016, when Real GDP was $9,475,497,772.
- GDP per Capita in Guinea (with a population of 12,067,519 people) was $868 in 2017, an increase of $61 from $807 in 2016; this represents a change of 7.6% in GDP per capita.
Gross Domestic Product : GDP of Guinea
| Year | GDP Nominal (Current USD) |
GDP Real (Inflation adj.) |
GDP change |
GDP per capita | Pop. change |
Population |
|---|---|---|---|---|---|---|
| 2017 | $10,472,514,515 | $10,480,310,146 | 10.60% | $868 | 2.80 % | 12,067,519 |
| 2016 | $8,694,360,305 | $9,475,497,772 | 10.45% | $807 | 2.68 % | 11,738,429 |
| 2015 | $8,794,202,410 | $8,578,674,103 | 3.81% | $750 | 2.52 % | 11,432,088 |
| 2014 | $8,778,473,641 | $8,263,428,449 | 3.71% | $741 | 2.37 % | 11,150,982 |
| 2013 | $8,376,613,797 | $7,968,018,035 | 3.93% | $731 | 2.26 % | 10,892,817 |
| 2012 | $7,638,045,248 | $7,666,363,201 | 5.92% | $720 | 2.22 % | 10,652,031 |
| 2011 | $6,785,137,222 | $7,238,091,704 | 5.61% | $695 | 2.24 % | 10,420,472 |
| 2010 | $6,853,467,936 | $6,853,467,936 | 4.82% | $672 | 2.29 % | 10,192,176 |
| 2009 | $6,716,904,635 | $6,538,276,246 | -1.12% | $656 | 2.32 % | 9,964,469 |
| 2008 | $6,964,179,255 | $6,612,176,482 | 4.14% | $679 | 2.32 % | 9,738,792 |
| 2007 | $6,281,917,560 | $6,349,521,164 | 6.83% | $667 | 2.26 % | 9,518,162 |
| 2006 | $4,220,019,228 | $5,943,715,508 | 1.18% | $639 | 2.17 % | 9,307,425 |
| 2005 | $2,937,071,767 | $5,874,389,462 | 3.00% | $645 | 2.06 % | 9,109,581 |
| 2004 | $3,666,349,049 | $5,703,441,766 | 2.34% | $639 | 1.97 % | 8,925,743 |
| 2003 | $3,446,442,219 | $5,573,026,411 | 1.25% | $637 | 1.95 % | 8,753,093 |
| 2002 | $2,949,637,039 | $5,504,299,656 | 5.16% | $641 | 2.01 % | 8,586,074 |
| 2001 | $2,833,442,750 | $5,233,984,782 | 3.66% | $622 | 2.14 % | 8,417,081 |
| 2000 | $2,995,360,969 | $5,049,265,168 | 2.50% | $613 | 2.31 % | 8,240,730 |
| 1999 | $3,461,282,294 | $4,925,965,274 | 3.81% | $612 | 2.47 % | 8,054,743 |
| 1998 | $3,588,376,057 | $4,745,082,536 | 3.64% | $604 | 2.59 % | 7,860,781 |
| 1997 | $3,783,788,551 | $4,578,245,712 | 5.18% | $598 | 2.66 % | 7,662,075 |
| 1996 | $3,869,032,271 | $4,352,705,760 | 4.46% | $583 | 2.67 % | 7,463,782 |
| 1995 | $3,693,753,379 | $4,166,800,813 | 4.61% | $573 | 2.66 % | 7,269,625 |
| 1994 | $3,383,218,923 | $3,983,264,980 | 3.97% | $563 | 2.67 % | 7,081,116 |