GDP of Hong Kong
| GDP nominal (2017) | GDP growth rate (2017) |
|---|---|
$341,449,340,451 |
3.79% |
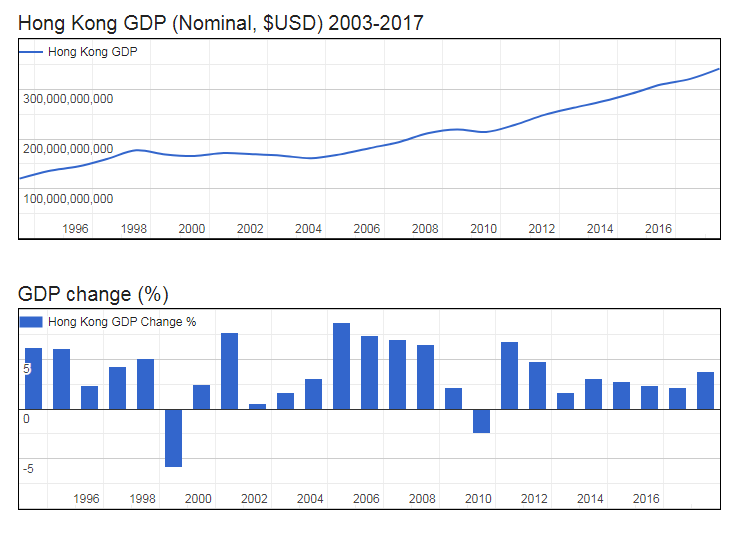
- Nominal (current) Gross Domestic Product (GDP of Hong Kong, Hong Kong SAR is $341,449,340,451 (USD) as of 2017.
- Real GDP (constant, inflation adjusted) of the Hong Kong Special Administrative Region of the People’s Republic of China reached $280,346,000,937 in 2017.
- GDP Growth Rate in 2017 was 3.79%, representing a change of 10,240,635,868 US$ over 2016, when Real GDP was $270,105,365,069.
- GDP per Capita in the Hong Kong Special Administrative Region of the People’s Republic of China (with a population of 7,306,322 people) was $38,370 in 2017, an increase of $1,081 from $37,289 in 2016; this represents a change of 2.9% in GDP per capita.
Gross Domestic Product (GDP of Hong Kong, Hong Kong SAR
| Year | GDP Nominal (Current USD) |
GDP Real (Inflation adj.) |
GDP change |
GDP per capita | Pop. change |
Population |
|---|---|---|---|---|---|---|
| 2017 | $341,449,340,451 | $280,346,000,937 | 3.79% | $38,370 | 0.87 % | 7,306,322 |
| 2016 | $320,881,182,124 | $270,105,365,069 | 2.16% | $37,289 | 0.80 % | 7,243,542 |
| 2015 | $309,383,627,029 | $264,386,879,659 | 2.39% | $36,792 | 0.72 % | 7,185,996 |
| 2014 | $291,459,356,985 | $258,220,961,506 | 2.76% | $36,192 | 0.65 % | 7,134,670 |
| 2013 | $275,696,879,835 | $251,279,572,791 | 3.10% | $35,448 | 0.60 % | 7,088,778 |
| 2012 | $262,629,441,493 | $243,720,605,436 | 1.70% | $34,586 | 0.57 % | 7,046,848 |
| 2011 | $248,513,617,677 | $239,645,887,721 | 4.81% | $34,203 | 0.58 % | 7,006,590 |
| 2010 | $228,637,697,575 | $228,637,697,575 | 6.77% | $32,820 | 0.60 % | 6,966,331 |
| 2009 | $214,046,415,026 | $214,145,040,905 | -2.46% | $30,925 | 0.62 % | 6,924,642 |
| 2008 | $219,279,678,430 | $219,543,730,107 | 2.13% | $31,902 | 0.61 % | 6,881,863 |
| 2007 | $211,597,405,594 | $214,969,310,482 | 6.46% | $31,428 | 0.56 % | 6,840,015 |
| 2006 | $193,536,265,094 | $201,915,790,973 | 7.03% | $29,684 | 0.48 % | 6,802,080 |
| 2005 | $181,570,082,162 | $188,648,640,222 | 7.39% | $27,867 | 0.37 % | 6,769,574 |
| 2004 | $169,099,768,875 | $175,669,728,984 | 8.70% | $26,046 | 0.30 % | 6,744,566 |
| 2003 | $161,384,522,525 | $161,609,648,468 | 3.06% | $24,032 | 0.34 % | 6,724,677 |
| 2002 | $166,349,228,737 | $156,816,826,142 | 1.66% | $23,399 | 0.56 % | 6,701,775 |
| 2001 | $169,403,241,524 | $154,261,275,971 | 0.56% | $23,146 | 0.88 % | 6,664,772 |
| 2000 | $171,668,164,083 | $153,400,895,123 | 7.66% | $23,220 | 1.29 % | 6,606,327 |
| 1999 | $165,768,095,392 | $142,481,844,511 | 2.51% | $21,845 | 1.64 % | 6,522,466 |
| 1998 | $168,886,163,222 | $138,997,594,871 | -5.88% | $21,661 | 1.86 % | 6,416,992 |
| 1997 | $177,352,785,420 | $147,685,446,096 | 5.10% | $23,442 | 1.85 % | 6,299,921 |
| 1996 | $159,717,233,622 | $140,519,365,030 | 4.26% | $22,717 | 1.67 % | 6,185,585 |
| 1995 | $144,652,912,433 | $134,779,624,938 | 2.37% | $22,152 | 1.41 % | 6,084,227 |
| 1994 | $135,812,069,769 | $131,654,427,603 | 6.04% | $21,944 | 1.20 % | 5,999,617 |