GDP of Kazakhstan
| GDP nominal (2017) | GDP growth rate (2017) |
|---|---|
$162,886,867,832 |
4.10% |
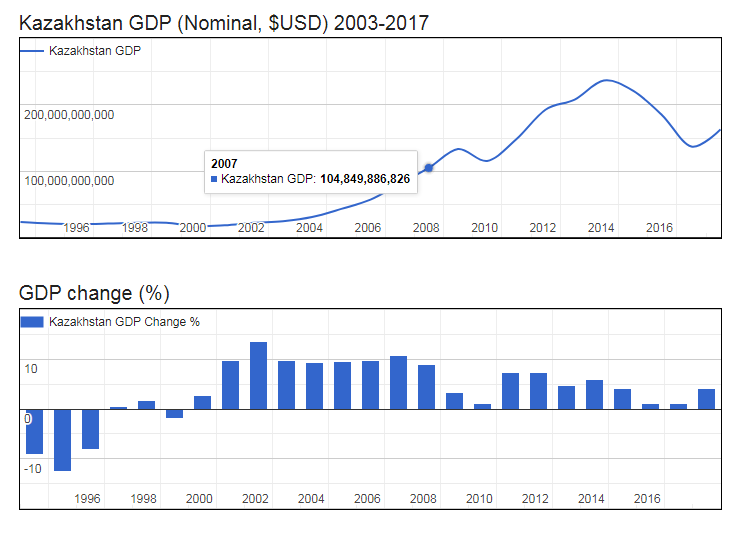
- Nominal (current) Gross Domestic Product (GDP) of Kazakhstan is $162,886,867,832 (USD) as of 2017.
- Real GDP (constant, inflation adjusted) of Kazakhstan reached $196,029,836,978 in 2017.
- GDP Growth Rate in 2017 was 4.10%, representing a change of 7,720,675,616 US$ over 2016, when Real GDP was $188,309,161,362.
- GDP per Capita in Kazakhstan (with a population of 18,080,019 people) was $10,842 in 2017, an increase of $282 from $10,561 in 2016; this represents a change of 2.7% in GDP per capita.
Gross Domestic Product (GDP of Kazakhstan
| Year | GDP Nominal (Current USD) |
GDP Real (Inflation adj.) |
GDP change |
GDP per capita | Pop. change |
Population |
|---|---|---|---|---|---|---|
| 2017 | $162,886,867,832 | $196,029,836,978 | 4.10% | $10,842 | 1.40 % | 18,080,019 |
| 2016 | $137,278,320,084 | $188,309,161,362 | 1.10% | $10,561 | 1.47 % | 17,830,901 |
| 2015 | $184,388,432,149 | $186,260,298,083 | 1.20% | $10,600 | 1.56 % | 17,572,016 |
| 2014 | $221,415,572,820 | $184,051,677,948 | 4.20% | $10,637 | 1.62 % | 17,302,615 |
| 2013 | $236,634,552,078 | $176,633,088,241 | 6.00% | $10,374 | 1.64 % | 17,026,117 |
| 2012 | $207,998,568,866 | $166,634,988,907 | 4.80% | $9,947 | 1.58 % | 16,751,525 |
| 2011 | $192,626,507,972 | $159,002,852,010 | 7.40% | $9,642 | 1.47 % | 16,490,670 |
| 2010 | $148,047,348,241 | $148,047,348,241 | 7.30% | $9,109 | 1.30 % | 16,252,279 |
| 2009 | $115,308,661,143 | $137,975,161,454 | 1.20% | $8,600 | 1.14 % | 16,043,007 |
| 2008 | $133,441,612,247 | $136,339,092,346 | 3.30% | $8,595 | 1.02 % | 15,862,123 |
| 2007 | $104,849,886,826 | $131,983,632,475 | 8.90% | $8,405 | 0.97 % | 15,702,104 |
| 2006 | $81,003,884,545 | $121,197,091,345 | 10.70% | $7,793 | 0.96 % | 15,551,268 |
| 2005 | $57,123,671,734 | $109,482,467,340 | 9.70% | $7,108 | 1.00 % | 15,402,807 |
| 2004 | $43,151,647,003 | $99,801,702,224 | 9.60% | $6,544 | 0.99 % | 15,250,015 |
| 2003 | $30,833,699,703 | $91,059,947,285 | 9.30% | $6,030 | 0.83 % | 15,100,041 |
| 2002 | $24,636,593,223 | $83,311,937,131 | 9.80% | $5,563 | 0.44 % | 14,976,188 |
| 2001 | $22,152,694,162 | $75,876,081,176 | 13.50% | $5,089 | -0.08 % | 14,910,205 |
| 2000 | $18,291,990,619 | $66,851,172,842 | 9.80% | $4,480 | -0.65 % | 14,922,719 |
| 1999 | $16,870,817,135 | $60,884,492,570 | 2.70% | $4,053 | -1.12 % | 15,020,571 |
| 1998 | $22,135,245,413 | $59,283,829,183 | -1.90% | $3,903 | -1.40 % | 15,190,157 |
| 1997 | $22,165,932,063 | $60,432,037,903 | 1.70% | $3,923 | -1.45 % | 15,406,003 |
| 1996 | $21,035,357,833 | $59,421,866,178 | 0.50% | $3,801 | -1.31 % | 15,631,927 |
| 1995 | $20,374,307,047 | $59,126,235,003 | -8.20% | $3,733 | -1.14 % | 15,839,363 |
| 1994 | $21,250,839,258 | $64,407,663,403 | -12.60% | $4,020 | -0.98 % | 16,022,222 |