GDP of Pakistan
| GDP nominal (2017) | GDP growth rate (2017) |
|---|---|
$304,951,818,494 |
5.70% |
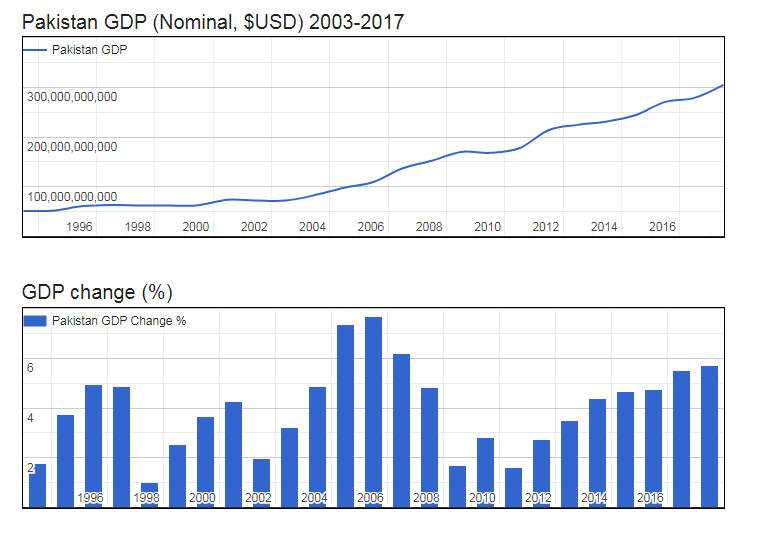
- Nominal (current) Gross Domestic Product (GDP of Pakistan is $304,951,818,494 (USD) as of 2017.
- Real GDP (constant, inflation adjusted) of Pakistan reached $240,856,714,914 in 2017.
- GDP Growth Rate in 2017 was 5.70%, representing a change of 12,989,828,148 US$ over 2016, when Real GDP was $227,866,886,766.
- GDP per Capita in Pakistan (with a population of 207,906,209 people) was $1,158 in 2017, an increase of $39 from $1,119 in 2016; this represents a change of 3.5% in GDP per capita.
Gross Domestic Product (GDP of Pakistan
| Year | GDP Nominal (Current USD) |
GDP Real (Inflation adj.) |
GDP change |
GDP per capita | Pop. change |
Population |
|---|---|---|---|---|---|---|
| 2017 | $304,951,818,494 | $240,856,714,914 | 5.70% | $1,158 | 2.10 % | 207,906,209 |
| 2016 | $278,654,637,738 | $227,866,886,766 | 5.53% | $1,119 | 2.11 % | 203,631,353 |
| 2015 | $270,556,126,820 | $215,932,848,621 | 4.73% | $1,083 | 2.11 % | 199,426,964 |
| 2014 | $244,360,888,751 | $206,178,251,481 | 4.67% | $1,056 | 2.11 % | 195,305,013 |
| 2013 | $231,218,567,179 | $196,970,457,771 | 4.40% | $1,030 | 2.13 % | 191,260,806 |
| 2012 | $224,383,620,830 | $188,675,424,552 | 3.51% | $1,007 | 2.15 % | 187,280,129 |
| 2011 | $213,587,413,184 | $182,282,709,027 | 2.75% | $994 | 2.18 % | 183,340,174 |
| 2010 | $177,406,854,515 | $177,406,854,515 | 1.61% | $989 | 2.22 % | 179,424,641 |
| 2009 | $168,152,775,283 | $174,601,545,522 | 2.83% | $995 | 2.26 % | 175,525,609 |
| 2008 | $170,077,814,106 | $169,793,571,392 | 1.70% | $989 | 2.29 % | 171,648,986 |
| 2007 | $152,385,716,312 | $166,953,023,525 | 4.83% | $995 | 2.31 % | 167,808,105 |
| 2006 | $137,264,061,106 | $159,256,450,281 | 6.18% | $971 | 2.32 % | 164,022,627 |
| 2005 | $109,502,102,511 | $149,990,711,055 | 7.67% | $936 | 2.32 % | 160,304,008 |
| 2004 | $97,977,766,198 | $139,309,432,952 | 7.37% | $889 | 2.33 % | 156,664,697 |
| 2003 | $83,244,801,093 | $129,748,800,034 | 4.85% | $848 | 2.37 % | 153,093,373 |
| 2002 | $72,306,820,396 | $123,751,409,564 | 3.22% | $827 | 2.45 % | 149,549,700 |
| 2001 | $72,309,738,921 | $119,885,776,649 | 1.98% | $821 | 2.55 % | 145,978,402 |
| 2000 | $73,952,374,970 | $117,555,262,344 | 4.26% | $826 | 2.68 % | 142,343,578 |
| 1999 | $62,973,855,719 | $112,751,930,855 | 3.66% | $813 | 2.80 % | 138,624,621 |
| 1998 | $62,191,955,814 | $108,770,776,064 | 2.55% | $807 | 2.89 % | 134,843,233 |
| 1997 | $62,433,300,338 | $106,065,848,423 | 1.01% | $809 | 2.91 % | 131,057,431 |
| 1996 | $63,320,122,807 | $105,000,725,251 | 4.85% | $825 | 2.89 % | 127,349,290 |
| 1995 | $60,636,022,423 | $100,147,018,592 | 4.96% | $809 | 2.84 % | 123,776,839 |
| 1994 | $51,894,781,282 | $95,412,089,508 | 3.74% | $793 | 2.80 % | 120,362,762 |