GDP of Poland
| GDP nominal (2017) | GDP growth rate (2017) |
|---|---|
$526,465,839,003 |
4.81% |
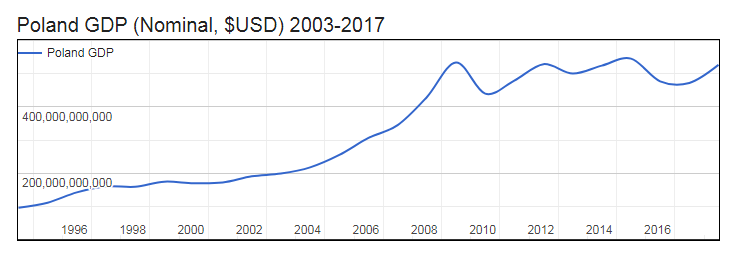
- Nominal (current) Gross Domestic Product (GGDP of Poland is $526,465,839,003 (USD) as of 2017.
- Real GDP (constant, inflation adjusted) of Poland reached $600,876,081,838 in 2017.
- GDP Growth Rate in 2017 was 4.81%, representing a change of 27,552,475,378 US$ over 2016, when Real GDP was $573,323,606,460.
- GDP per Capita in Poland (with a population of 37,953,180 people) was $15,832 in 2017, an increase of $740 from $15,092 in 2016; this represents a change of 4.9% in GDP per capita.

Gross Domestic Product (GDP of Poland
| Year | GDP Nominal (Current USD) |
GDP Real (Inflation adj.) |
GDP change |
GDP per capita | Pop. change |
Population |
|---|---|---|---|---|---|---|
| 2017 | $526,465,839,003 | $600,876,081,838 | 4.81% | $15,832 | -0.09 % | 37,953,180 |
| 2016 | $471,992,087,444 | $573,323,606,460 | 3.06% | $15,092 | -0.12 % | 37,989,220 |
| 2015 | $476,970,902,629 | $556,286,765,925 | 3.84% | $14,626 | -0.15 % | 38,034,079 |
| 2014 | $545,285,410,922 | $535,720,728,189 | 3.32% | $14,064 | -0.18 % | 38,091,089 |
| 2013 | $524,201,151,607 | $518,514,109,494 | 1.39% | $13,589 | -0.18 % | 38,158,041 |
| 2012 | $500,284,003,684 | $511,396,027,456 | 1.61% | $13,378 | -0.16 % | 38,227,044 |
| 2011 | $528,725,113,046 | $503,303,378,983 | 5.02% | $13,146 | -0.11 % | 38,286,831 |
| 2010 | $479,257,883,742 | $479,257,883,742 | 3.61% | $12,504 | -0.06 % | 38,329,781 |
| 2009 | $439,796,160,379 | $462,573,200,252 | 2.82% | $12,061 | -0.01 % | 38,351,916 |
| 2008 | $533,815,789,474 | $449,885,267,102 | 4.25% | $11,729 | 0.01 % | 38,356,786 |
| 2007 | $429,063,549,984 | $431,545,815,101 | 7.03% | $11,252 | 0.00 % | 38,353,338 |
| 2006 | $344,748,646,558 | $403,182,709,819 | 6.18% | $10,512 | -0.04 % | 38,354,450 |
| 2005 | $306,125,173,853 | $379,717,662,035 | 3.49% | $9,896 | -0.08 % | 38,368,949 |
| 2004 | $255,102,252,843 | $366,899,448,221 | 5.14% | $9,555 | -0.11 % | 38,399,558 |
| 2003 | $217,513,049,292 | $348,977,202,208 | 3.56% | $9,078 | -0.12 % | 38,441,824 |
| 2002 | $198,680,637,255 | $336,972,647,511 | 2.04% | $8,755 | -0.11 % | 38,488,647 |
| 2001 | $190,521,263,343 | $330,230,645,787 | 1.25% | $8,571 | -0.07 % | 38,529,582 |
| 2000 | $171,885,598,583 | $326,160,149,385 | 4.56% | $8,459 | -0.03 % | 38,556,693 |
| 1999 | $169,717,677,901 | $311,937,152,867 | 4.64% | $8,088 | 0.01 % | 38,567,854 |
| 1998 | $174,388,271,854 | $298,098,779,421 | 4.61% | $7,730 | 0.05 % | 38,564,195 |
| 1997 | $159,117,799,530 | $284,949,370,362 | 6.46% | $7,393 | 0.09 % | 38,544,841 |
| 1996 | $159,954,007,641 | $267,659,755,082 | 6.06% | $6,950 | 0.13 % | 38,509,666 |
| 1995 | $142,137,319,588 | $252,374,493,219 | 6.95% | $6,562 | 0.18 % | 38,458,638 |
| 1994 | $110,803,391,517 | $235,970,184,335 | 5.29% | $6,147 | 0.23 % | 38,389,467 |