GDP of Russia
| GDP nominal (2017) | GDP growth rate (2017) |
|---|---|
$1,578,417,211,937 |
1.55% |
- Nominal (current) Gross Domestic Product (GDP of Russia is $1,578,417,211,937 (USD) as of 2017.
- Real GDP (constant, inflation adjusted) of the Russian Federation reached $1,681,681,966,623 in 2017.
- GDP Growth Rate in 2017 was 1.55%, representing a change of 27,246,625,508 US$ over 2016, when Real GDP was $1,654,435,341,115.
- GDP per Capita in the Russian Federation (with a population of 145,530,082 people) was $11,556 in 2017, an increase of $167 from $11,388 in 2016; this represents a change of 1.5% in GDP per capita.

Russia Gross Domestic Product (GDP of Russia
| Year | GDP Nominal (Current USD) |
GDP Real (Inflation adj.) |
GDP change |
GDP per capita | Pop. change |
Population |
|---|---|---|---|---|---|---|
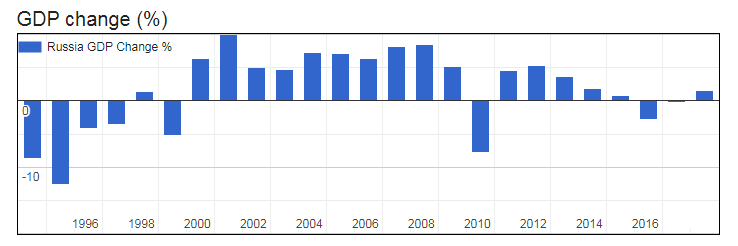
| 2017 | $1,578,417,211,937 | $1,681,681,966,623 | 1.55% | $11,556 | 0.18 % | 145,530,082 |
| 2016 | $1,282,663,609,771 | $1,654,435,341,115 | -0.22% | $11,388 | 0.20 % | 145,275,383 |
| 2015 | $1,363,705,265,461 | $1,658,164,735,743 | -2.83% | $11,437 | 0.22 % | 144,985,057 |
| 2014 | $2,063,662,665,173 | $1,706,426,588,985 | 0.74% | $11,796 | 0.24 % | 144,664,841 |
| 2013 | $2,297,128,039,058 | $1,693,915,317,354 | 1.79% | $11,737 | 0.23 % | 144,325,449 |
| 2012 | $2,210,256,976,945 | $1,664,203,387,274 | 3.66% | $11,557 | 0.20 % | 143,993,892 |
| 2011 | $2,051,661,732,059 | $1,605,507,609,330 | 5.28% | $11,172 | 0.16 % | 143,703,025 |
| 2010 | $1,524,917,468,443 | $1,524,917,468,443 | 4.50% | $10,628 | 0.11 % | 143,479,274 |
| 2009 | $1,222,644,282,200 | $1,459,199,142,720 | -7.82% | $10,181 | 0.05 % | 143,326,913 |
| 2008 | $1,660,846,387,626 | $1,583,004,071,093 | 5.25% | $11,051 | -0.01 % | 143,248,764 |
| 2007 | $1,299,705,764,824 | $1,504,071,117,742 | 8.54% | $10,498 | -0.10 % | 143,266,212 |
| 2006 | $989,930,542,279 | $1,385,792,607,183 | 8.15% | $9,664 | -0.19 % | 143,403,256 |
| 2005 | $764,017,107,993 | $1,281,320,973,272 | 6.38% | $8,918 | -0.28 % | 143,672,116 |
| 2004 | $591,016,690,743 | $1,204,518,613,688 | 7.18% | $8,360 | -0.37 % | 144,080,643 |
| 2003 | $430,347,770,733 | $1,123,870,255,188 | 7.30% | $7,772 | -0.42 % | 144,610,882 |
| 2002 | $345,470,494,418 | $1,047,449,840,626 | 4.74% | $7,213 | -0.42 % | 145,215,700 |
| 2001 | $306,602,070,621 | $1,000,012,546,493 | 5.09% | $6,857 | -0.39 % | 145,830,721 |
| 2000 | $259,710,142,197 | $951,559,297,133 | 10.00% | $6,500 | -0.35 % | 146,404,903 |
| 1999 | $195,907,128,351 | $865,053,906,490 | 6.40% | $5,888 | -0.30 % | 146,915,915 |
| 1998 | $270,955,486,862 | $813,020,588,806 | -5.30% | $5,517 | -0.25 % | 147,360,604 |
| 1997 | $404,928,954,192 | $858,522,269,054 | 1.40% | $5,811 | -0.20 % | 147,730,019 |
| 1996 | $391,724,890,744 | $846,668,904,398 | -3.60% | $5,720 | -0.14 % | 148,020,847 |
| 1995 | $395,537,185,735 | $878,287,245,230 | -4.14% | $5,925 | -0.08 % | 148,227,466 |
| 1994 | $395,077,301,248 | $916,252,424,716 | -12.57% | $6,176 | -0.02 % | 148,349,441 |