GDP of Singapore
| GDP nominal (2017) | GDP growth rate (2017) |
|---|---|
$323,907,234,412 |
3.62% |
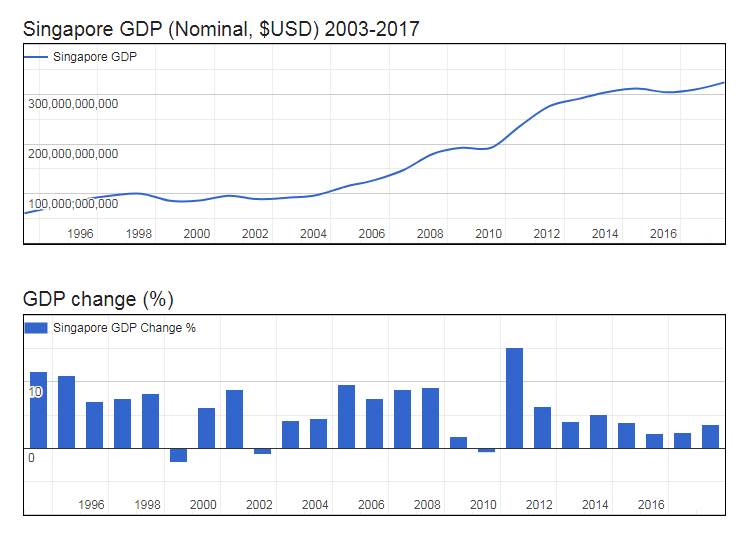
- Nominal (current) Gross Domestic Product : GDP of Singaporeis $323,907,234,412 (USD) as of 2017.
- Real GDP (constant, inflation adjusted) of Singapore reached $309,995,672,901 in 2017.
- GDP Growth Rate in 2017 was 3.62%, representing a change of 10,825,595,893 US$ over 2016, when Real GDP was $299,170,077,008.
- GDP per Capita in Singapore (with a population of 5,708,041 people) was $54,309 in 2017, an increase of $1,392 from $52,916 in 2016; this represents a change of 2.6% in GDP per capita.
Gross Domestic Product (GDP of Singapore
| Year | GDP Nominal (Current USD) |
GDP Real (Inflation adj.) |
GDP change |
GDP per capita | Pop. change |
Population |
|---|---|---|---|---|---|---|
| 2017 | $323,907,234,412 | $309,995,672,901 | 3.62% | $54,309 | 0.96 % | 5,708,041 |
| 2016 | $309,763,879,841 | $299,170,077,008 | 2.40% | $52,916 | 1.10 % | 5,653,634 |
| 2015 | $304,097,759,674 | $292,166,776,678 | 2.24% | $52,246 | 1.20 % | 5,592,152 |
| 2014 | $311,539,499,645 | $285,762,669,600 | 3.88% | $51,716 | 1.32 % | 5,525,626 |
| 2013 | $304,454,327,499 | $275,078,914,558 | 5.11% | $50,439 | 1.57 % | 5,453,737 |
| 2012 | $290,673,681,684 | $261,703,043,638 | 4.08% | $48,739 | 2.01 % | 5,369,476 |
| 2011 | $275,966,926,379 | $251,436,156,949 | 6.35% | $47,769 | 2.58 % | 5,263,636 |
| 2010 | $236,421,782,178 | $236,421,782,178 | 15.24% | $46,076 | 3.31 % | 5,131,172 |
| 2009 | $192,408,387,762 | $205,155,335,534 | -0.60% | $41,307 | 4.00 % | 4,966,614 |
| 2008 | $192,225,881,688 | $206,400,733,407 | 1.79% | $43,218 | 4.31 % | 4,775,804 |
| 2007 | $179,981,288,567 | $202,775,870,920 | 9.11% | $44,287 | 4.00 % | 4,578,630 |
| 2006 | $147,797,218,201 | $185,842,757,609 | 8.86% | $42,215 | 3.20 % | 4,402,331 |
| 2005 | $127,417,688,056 | $170,716,905,024 | 7.49% | $40,021 | 2.12 % | 4,265,687 |
| 2004 | $114,188,557,567 | $158,822,442,244 | 9.55% | $38,021 | 1.16 % | 4,177,213 |
| 2003 | $97,001,377,569 | $144,978,217,822 | 4.44% | $35,110 | 0.60 % | 4,129,225 |
| 2002 | $91,941,192,896 | $138,821,048,772 | 4.21% | $33,822 | 0.67 % | 4,104,419 |
| 2001 | $89,286,208,629 | $133,210,634,397 | -0.95% | $32,673 | 1.20 % | 4,077,145 |
| 2000 | $95,833,932,715 | $134,491,382,472 | 8.90% | $33,382 | 1.87 % | 4,028,871 |
| 1999 | $86,283,126,844 | $123,502,676,934 | 6.10% | $31,229 | 2.44 % | 3,954,743 |
| 1998 | $85,707,636,233 | $116,407,407,407 | -2.23% | $30,152 | 2.89 % | 3,860,714 |
| 1997 | $100,163,995,151 | $119,056,692,336 | 8.29% | $31,730 | 3.13 % | 3,752,140 |
| 1996 | $96,403,758,865 | $109,941,327,466 | 7.53% | $30,219 | 3.18 % | 3,638,187 |
| 1995 | $87,890,009,877 | $102,240,630,730 | 7.03% | $28,996 | 3.23 % | 3,525,969 |
| 1994 | $73,777,792,327 | $95,526,952,695 | 10.93% | $27,967 | 3.32 % | 3,415,703 |