GDP of Solomon Islands
| GDP nominal (2017) | GDP growth rate (2017) |
|---|---|
$1,303,453,622 |
3.24% |
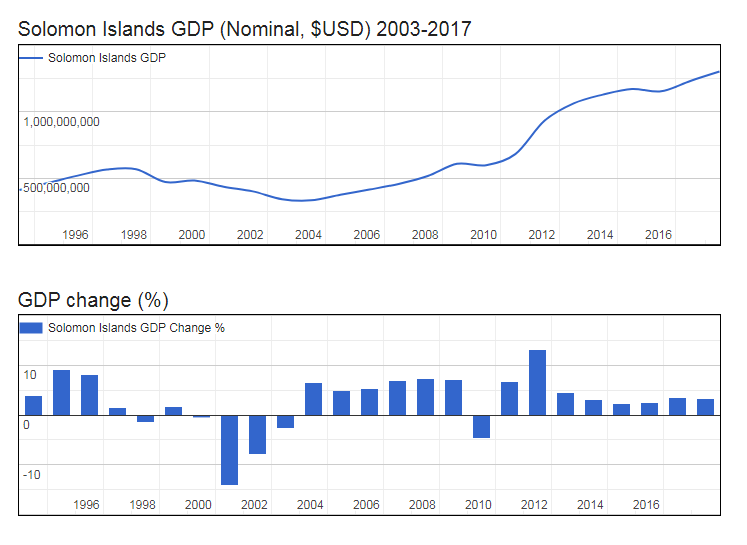
- Nominal (current) Gross Domestic Product (GDP of Solomon Islands is $1,303,453,622 (USD) as of 2017.
- Real GDP (constant, inflation adjusted) of the Solomon Islands reached $930,032,625 in 2017.
- GDP Growth Rate in 2017 was 3.24%, representing a change of 29,173,572 US$ over 2016, when Real GDP was $900,859,053.
- GDP per Capita in the Solomon Islands (with a population of 636,039 people) was $1,462 in 2017, an increase of $8 from $1,454 in 2016; this represents a change of 0.5% in GDP per capita.
Gross Domestic Product (GDP of Solomon Islands
| Year | GDP Nominal (Current USD) |
GDP Real (Inflation adj.) |
GDP change |
GDP per capita | Pop. change |
Population |
|---|---|---|---|---|---|---|
| 2017 | $1,303,453,622 | $930,032,625 | 3.24% | $1,462 | 2.68 % | 636,039 |
| 2016 | $1,232,699,139 | $900,859,053 | 3.46% | $1,454 | 2.71 % | 619,438 |
| 2015 | $1,154,650,069 | $870,760,297 | 2.54% | $1,444 | 2.73 % | 603,118 |
| 2014 | $1,172,268,301 | $849,172,302 | 2.25% | $1,446 | 2.76 % | 587,079 |
| 2013 | $1,129,787,198 | $830,485,620 | 3.02% | $1,454 | 2.75 % | 571,336 |
| 2012 | $1,063,879,446 | $806,157,014 | 4.56% | $1,450 | 2.69 % | 556,063 |
| 2011 | $932,725,583 | $771,033,399 | 13.20% | $1,424 | 2.59 % | 541,521 |
| 2010 | $681,151,194 | $681,151,194 | 6.81% | $1,290 | 2.46 % | 527,861 |
| 2009 | $597,765,363 | $637,728,007 | -4.73% | $1,238 | 2.35 % | 515,181 |
| 2008 | $608,293,860 | $669,375,213 | 7.09% | $1,330 | 2.28 % | 503,360 |
| 2007 | $516,074,229 | $625,032,325 | 7.32% | $1,270 | 2.30 % | 492,132 |
| 2006 | $456,705,434 | $582,400,594 | 6.95% | $1,211 | 2.37 % | 481,078 |
| 2005 | $413,909,879 | $544,571,143 | 5.42% | $1,159 | 2.48 % | 469,918 |
| 2004 | $375,111,895 | $516,567,045 | 4.90% | $1,127 | 2.58 % | 458,539 |
| 2003 | $332,738,246 | $492,445,250 | 6.50% | $1,102 | 2.66 % | 447,017 |
| 2002 | $341,661,644 | $462,389,898 | -2.80% | $1,062 | 2.71 % | 435,432 |
| 2001 | $400,463,452 | $475,709,784 | -7.98% | $1,122 | 2.73 % | 423,944 |
| 2000 | $435,103,853 | $516,955,404 | -14.27% | $1,253 | 2.76 % | 412,660 |
| 1999 | $482,214,092 | $602,986,384 | -0.48% | $1,502 | 2.79 % | 401,586 |
| 1998 | $471,177,008 | $605,910,512 | 1.78% | $1,551 | 2.81 % | 390,693 |
| 1997 | $567,919,503 | $595,291,311 | -1.44% | $1,567 | 2.84 % | 379,999 |
| 1996 | $565,163,751 | $603,986,749 | 1.61% | $1,635 | 2.85 % | 369,523 |
| 1995 | $519,334,097 | $594,444,840 | 8.22% | $1,655 | 2.86 % | 359,281 |
| 1994 | $464,756,639 | $549,274,727 | 9.19% | $1,573 | 2.88 % | 349,281 |