GDP of Sri Lanka
| GDP nominal (2017) | GDP growth rate (2017) |
|---|---|
$87,357,205,923 |
3.31% |
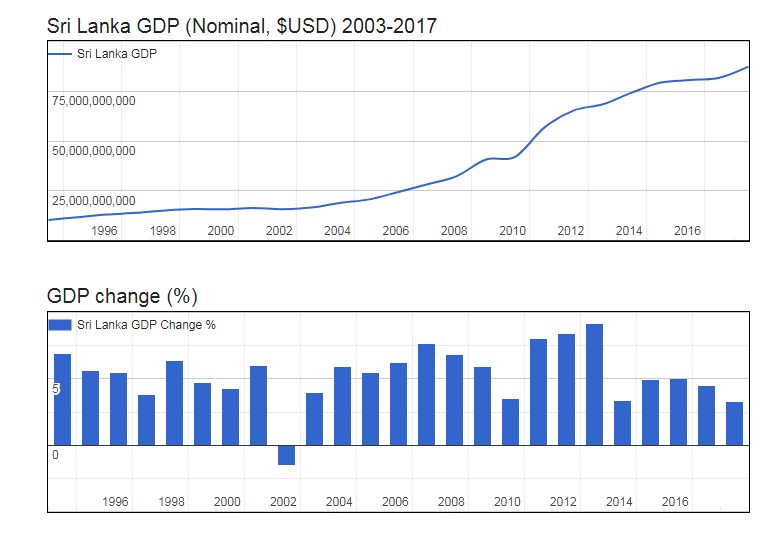
- Nominal (current) Gross Domestic Product (GDP) of Sri Lanka is $87,357,205,923 (USD) as of 2017.
- Real GDP (constant, inflation adjusted) of Sri Lanka reached $82,547,720,664 in 2017.
- GDP Growth Rate in 2017 was 3.31%, representing a change of 2,643,858,692 US$ over 2016, when Real GDP was $79,903,861,972.
- GDP per Capita in Sri Lanka (with a population of 21,128,032 people) was $3,907 in 2017, an increase of $106 from $3,801 in 2016; this represents a change of 2.8% in GDP per capita.
Gross Domestic Product (GDP of Sri Lanka
| Year | GDP Nominal (Current USD) |
GDP Real (Inflation adj.) |
GDP change |
GDP per capita | Pop. change |
Population |
|---|---|---|---|---|---|---|
| 2017 | $87,357,205,923 | $82,547,720,664 | 3.31% | $3,907 | 0.51 % | 21,128,032 |
| 2016 | $81,787,420,023 | $79,903,861,972 | 4.47% | $3,801 | 0.54 % | 21,021,171 |
| 2015 | $80,604,080,689 | $76,485,840,044 | 5.01% | $3,658 | 0.57 % | 20,908,027 |
| 2014 | $79,356,449,841 | $72,838,327,290 | 4.96% | $3,504 | 0.61 % | 20,788,511 |
| 2013 | $74,317,806,538 | $69,395,808,983 | 3.40% | $3,358 | 0.64 % | 20,663,046 |
| 2012 | $68,434,409,315 | $67,116,705,113 | 9.14% | $3,269 | 0.66 % | 20,532,600 |
| 2011 | $65,292,753,006 | $61,493,396,999 | 8.40% | $3,015 | 0.67 % | 20,398,497 |
| 2010 | $56,725,749,222 | $56,725,749,222 | 8.02% | $2,800 | 0.69 % | 20,261,737 |
| 2009 | $42,066,217,872 | $52,516,077,579 | 3.54% | $2,610 | 0.70 % | 20,123,508 |
| 2008 | $40,713,812,310 | $50,721,102,373 | 5.95% | $2,538 | 0.72 % | 19,983,984 |
| 2007 | $32,350,248,411 | $47,872,638,203 | 6.80% | $2,413 | 0.74 % | 19,842,044 |
| 2006 | $28,279,814,925 | $44,825,899,741 | 7.67% | $2,276 | 0.77 % | 19,695,972 |
| 2005 | $24,405,791,045 | $41,633,334,151 | 6.24% | $2,130 | 0.81 % | 19,544,988 |
| 2004 | $20,662,525,941 | $39,187,357,999 | 5.45% | $2,021 | 0.85 % | 19,387,153 |
| 2003 | $18,881,765,437 | $37,163,768,055 | 5.94% | $1,933 | 0.85 % | 19,224,037 |
| 2002 | $16,536,535,647 | $35,079,926,055 | 3.96% | $1,840 | 0.80 % | 19,062,482 |
| 2001 | $15,749,753,805 | $33,742,158,886 | -1.55% | $1,784 | 0.71 % | 18,911,730 |
| 2000 | $16,330,814,180 | $34,271,798,041 | 6.00% | $1,825 | 0.61 % | 18,777,601 |
| 1999 | $15,656,327,860 | $32,331,874,830 | 4.30% | $1,732 | 0.53 % | 18,663,284 |
| 1998 | $15,794,972,847 | $30,998,760,577 | 4.70% | $1,670 | 0.51 % | 18,564,599 |
| 1997 | $15,091,913,884 | $29,607,667,122 | 6.41% | $1,603 | 0.56 % | 18,470,900 |
| 1996 | $13,897,738,375 | $27,825,342,704 | 3.80% | $1,515 | 0.68 % | 18,367,288 |
| 1995 | $13,029,697,561 | $26,806,697,009 | 5.50% | $1,469 | 0.82 % | 18,242,912 |
| 1994 | $11,717,604,209 | $25,409,170,950 | 5.60% | $1,404 | 0.95 % | 18,094,477 |