GDP of Trinidad and Tobago
| GDP nominal (2017) | GDP growth rate (2017) |
|---|---|
$22,079,017,627 |
-2.34% |
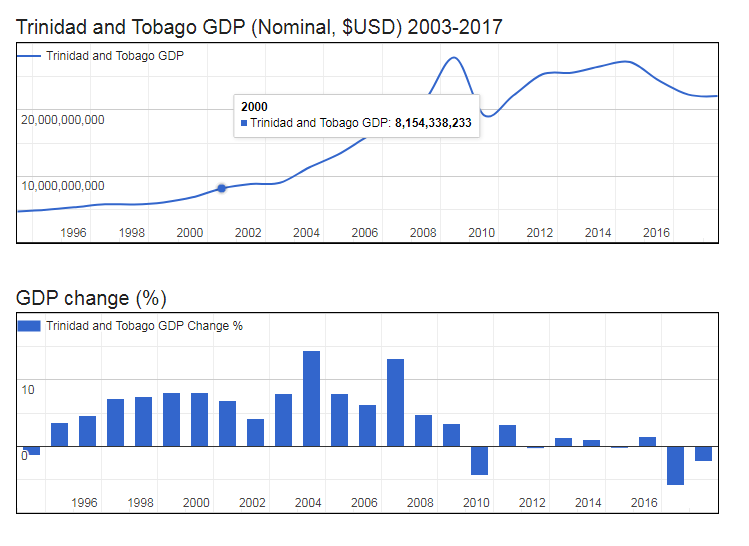
- Nominal (current) Gross Domestic Product GDP of Trinidad and Tobago is $22,079,017,627 (USD) as of 2017.
- Real GDP (constant, inflation adjusted) of Trinidad and Tobago reached $21,016,574,011 in 2017.
- GDP Growth Rate in 2017 was -2.34%, representing a change of -502,693,120 US$ over 2016, when Real GDP was $21,519,267,131.
- GDP per Capita in Trinidad and Tobago (with a population of 1,384,059 people) was $15,185 in 2017, a decrease of $437 from $15,621 in 2016; this represents a change of -2.8% in GDP per capita.
Gross Domestic Product GDP of Trinidad and Tobago
| Year | GDP Nominal (Current USD) |
GDP Real (Inflation adj.) |
GDP change |
GDP per capita | Pop. change |
Population |
|---|---|---|---|---|---|---|
| 2017 | $22,079,017,627 | $21,016,574,011 | -2.34% | $15,185 | 0.47 % | 1,384,059 |
| 2016 | $22,295,585,700 | $21,519,267,131 | -5.96% | $15,621 | 0.53 % | 1,377,560 |
| 2015 | $24,401,734,195 | $22,882,384,833 | 1.52% | $16,698 | 0.59 % | 1,370,328 |
| 2014 | $27,200,280,855 | $22,540,410,080 | -0.25% | $16,545 | 0.64 % | 1,362,345 |
| 2013 | $26,578,524,198 | $22,597,392,289 | 0.98% | $16,693 | 0.66 % | 1,353,703 |
| 2012 | $25,601,811,994 | $22,377,898,712 | 1.29% | $16,640 | 0.65 % | 1,344,819 |
| 2011 | $25,366,520,907 | $22,092,032,459 | -0.29% | $16,534 | 0.60 % | 1,336,178 |
| 2010 | $22,157,253,321 | $22,157,253,321 | 3.32% | $16,683 | 0.55 % | 1,328,147 |
| 2009 | $19,172,165,226 | $21,444,579,083 | -4.39% | $16,234 | 0.49 % | 1,320,930 |
| 2008 | $27,871,587,350 | $22,429,360,906 | 3.39% | $17,064 | 0.46 % | 1,314,443 |
| 2007 | $21,641,620,050 | $21,693,848,050 | 4.75% | $16,580 | 0.45 % | 1,308,451 |
| 2006 | $18,369,361,094 | $20,709,289,102 | 13.21% | $15,899 | 0.47 % | 1,302,561 |
| 2005 | $15,982,282,462 | $18,293,122,881 | 6.21% | $14,110 | 0.49 % | 1,296,502 |
| 2004 | $13,280,275,123 | $17,223,704,282 | 7.95% | $13,350 | 0.51 % | 1,290,123 |
| 2003 | $11,305,459,802 | $15,955,321,093 | 14.44% | $12,431 | 0.50 % | 1,283,559 |
| 2002 | $9,008,273,721 | $13,941,911,585 | 7.94% | $10,916 | 0.44 % | 1,277,213 |
| 2001 | $8,824,873,259 | $12,916,746,892 | 4.17% | $10,158 | 0.35 % | 1,271,632 |
| 2000 | $8,154,338,233 | $12,399,855,901 | 6.90% | $9,786 | 0.25 % | 1,267,153 |
| 1999 | $6,808,982,521 | $11,599,343,510 | 8.02% | $9,177 | 0.18 % | 1,263,933 |
| 1998 | $6,043,694,330 | $10,737,665,442 | 8.12% | $8,511 | 0.15 % | 1,261,695 |
| 1997 | $5,737,751,332 | $9,930,828,889 | 7.52% | $7,883 | 0.18 % | 1,259,848 |
| 1996 | $5,759,537,726 | $9,236,016,766 | 7.13% | $7,344 | 0.27 % | 1,257,549 |
| 1995 | $5,329,214,163 | $8,620,956,576 | 4.66% | $6,874 | 0.37 % | 1,254,200 |
| 1994 | $4,947,205,860 | $8,237,331,450 | 3.57% | $6,592 | 0.47 % | 1,249,520 |