
Antigua and Barbuda GDP
| GDP nominal (2017) | GDP growth rate (2017) |
|---|---|
$1,510,084,751 |
3.03% |
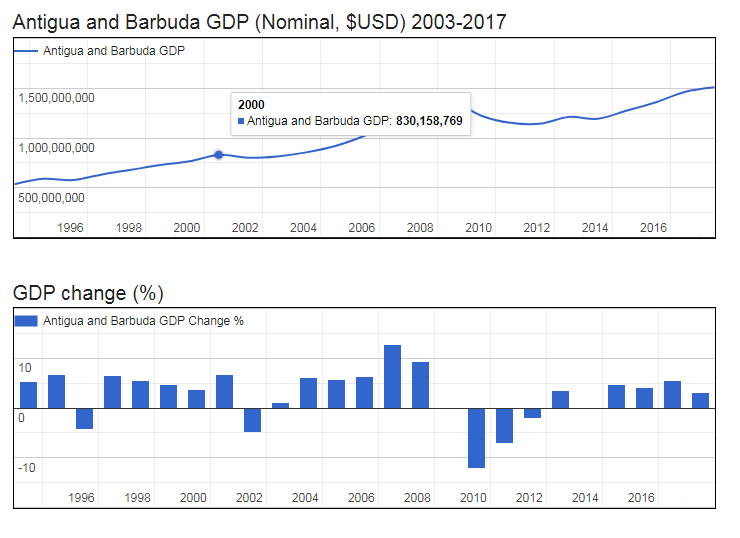
- Nominal (current) Gross Domestic Product (Antigua and Barbuda GDP is $1,510,084,751 (USD) as of 2017.
- Real GDP (constant, inflation adjusted) of Antigua and Barbuda reached $1,382,074,643 in 2017.
- GDP Growth Rate in 2017 was 3.03%, representing a change of 40,679,239 US$ over 2016, when Real GDP was $1,341,395,404.
- GDP per Capita in Antigua and Barbuda (with a population of 95,426 people) was $14,483 in 2017, an increase of $293 from $14,191 in 2016; this represents a change of 2.1% in GDP per capita.
Gross Domestic Product (Antigua and Barbuda GDP
| Year | GDP Nominal (Current USD) |
GDP Real (Inflation adj.) |
GDP change |
GDP per capita | Pop. change |
Population |
|---|---|---|---|---|---|---|
| 2017 | $1,510,084,751 | $1,382,074,643 | 3.03% | $14,483 | 0.95 % | 95,426 |
| 2016 | $1,464,630,213 | $1,341,395,404 | 5.59% | $14,191 | 1.03 % | 94,527 |
| 2015 | $1,359,194,737 | $1,270,384,239 | 4.03% | $13,577 | 1.08 % | 93,566 |
| 2014 | $1,275,576,784 | $1,221,221,065 | 4.66% | $13,194 | 1.14 % | 92,562 |
| 2013 | $1,192,919,619 | $1,166,866,906 | -0.10% | $12,750 | 1.22 % | 91,516 |
| 2012 | $1,211,411,704 | $1,168,080,145 | 3.51% | $12,920 | 1.30 % | 90,409 |
| 2011 | $1,142,042,916 | $1,128,507,775 | -2.08% | $12,644 | 1.39 % | 89,253 |
| 2010 | $1,152,469,069 | $1,152,469,069 | -7.20% | $13,092 | 1.48 % | 88,028 |
| 2009 | $1,224,253,014 | $1,241,885,106 | -12.11% | $14,316 | 1.58 % | 86,746 |
| 2008 | $1,368,431,043 | $1,412,959,730 | -0.03% | $16,546 | 1.63 % | 85,397 |
| 2007 | $1,311,401,319 | $1,413,385,626 | 9.26% | $16,821 | 1.60 % | 84,026 |
| 2006 | $1,157,005,441 | $1,293,605,271 | 12.73% | $15,641 | 1.52 % | 82,704 |
| 2005 | $1,022,191,294 | $1,147,540,484 | 6.41% | $14,086 | 1.41 % | 81,465 |
| 2004 | $919,577,143 | $1,078,389,759 | 5.74% | $13,423 | 1.31 % | 80,336 |
| 2003 | $855,643,100 | $1,019,884,489 | 6.06% | $12,861 | 1.28 % | 79,300 |
| 2002 | $814,615,324 | $961,629,833 | 1.02% | $12,282 | 1.40 % | 78,295 |
| 2001 | $800,740,257 | $951,881,607 | -4.95% | $12,328 | 1.57 % | 77,212 |
| 2000 | $830,158,769 | $1,001,496,498 | 6.69% | $13,175 | 1.80 % | 76,016 |
| 1999 | $766,198,910 | $938,682,324 | 3.71% | $12,570 | 1.98 % | 74,674 |
| 1998 | $727,860,578 | $905,121,378 | 4.73% | $12,361 | 2.12 % | 73,224 |
| 1997 | $680,617,123 | $864,231,854 | 5.47% | $12,053 | 2.18 % | 71,704 |
| 1996 | $633,730,647 | $819,401,314 | 6.60% | $11,677 | 2.19 % | 70,173 |
| 1995 | $577,280,727 | $768,634,418 | -4.36% | $11,193 | 2.18 % | 68,670 |
| 1994 | $589,429,610 | $803,670,388 | 6.68% | $11,959 | 2.17 % | 67,204 |