GDP of Belarus
| GDP nominal (2017) | GDP growth rate (2017) |
|---|---|
$54,456,465,473 |
2.42% |
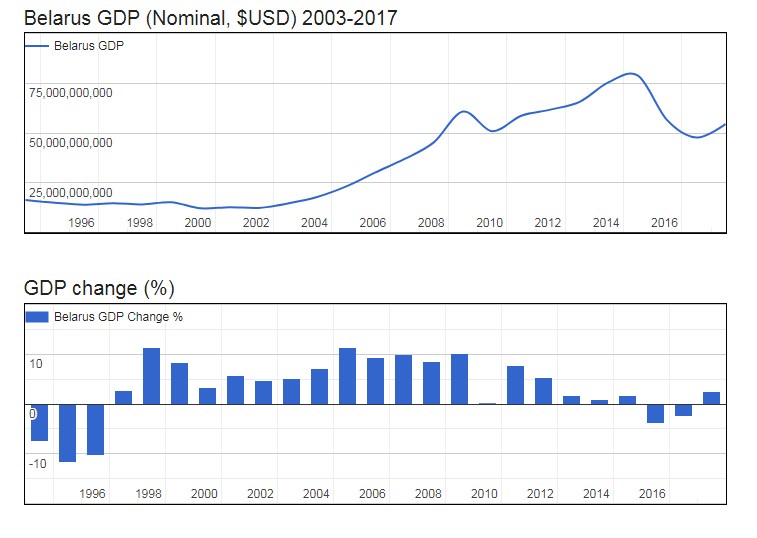
- Nominal (current) Gross Domestic Product (GDP of Belarus is $54,456,465,473 (USD) as of 2017.
- Real GDP (constant, inflation adjusted) of Belarus reached $62,013,997,099 in 2017.
- GDP Growth Rate in 2017 was 2.42%, representing a change of 1,466,404,786 US$ over 2016, when Real GDP was $60,547,592,313.
- GDP per Capita in Belarus (with a population of 9,450,231 people) was $6,562 in 2017, an increase of $152 from $6,410 in 2016; this represents a change of 2.4% in GDP per capita.
Gross Domestic Product (GDP of Belarus
| Year | GDP Nominal (Current USD) |
GDP Real (Inflation adj.) |
GDP change |
GDP per capita | Pop. change |
Population |
|---|---|---|---|---|---|---|
| 2017 | $54,456,465,473 | $62,013,997,099 | 2.42% | $6,562 | 0.05 % | 9,450,231 |
| 2016 | $47,749,057,078 | $60,547,592,313 | -2.53% | $6,410 | 0.07 % | 9,445,643 |
| 2015 | $56,454,734,397 | $62,116,943,621 | -3.83% | $6,581 | 0.08 % | 9,439,423 |
| 2014 | $78,813,839,984 | $64,590,481,691 | 1.73% | $6,848 | 0.09 % | 9,431,735 |
| 2013 | $75,527,984,234 | $63,494,325,276 | 1.00% | $6,738 | 0.07 % | 9,423,506 |
| 2012 | $65,685,102,555 | $62,863,508,301 | 1.69% | $6,676 | 0.02 % | 9,417,046 |
| 2011 | $61,757,788,945 | $61,820,512,466 | 5.38% | $6,566 | -0.06 % | 9,415,320 |
| 2010 | $58,665,088,956 | $58,665,088,956 | 7.80% | $6,227 | -0.13 % | 9,420,574 |
| 2009 | $50,874,078,052 | $54,421,180,122 | 0.20% | $5,769 | -0.21 % | 9,433,152 |
| 2008 | $60,763,483,146 | $54,312,557,593 | 10.20% | $5,746 | -0.29 % | 9,452,855 |
| 2007 | $45,277,399,814 | $49,285,442,639 | 8.60% | $5,199 | -0.38 % | 9,480,515 |
| 2006 | $36,954,312,354 | $45,382,541,132 | 10.00% | $4,769 | -0.47 % | 9,516,883 |
| 2005 | $30,207,567,317 | $41,256,857,576 | 9.40% | $4,315 | -0.57 % | 9,562,088 |
| 2004 | $23,144,351,852 | $37,711,935,052 | 11.45% | $3,922 | -0.65 % | 9,616,634 |
| 2003 | $17,827,791,321 | $33,837,615,109 | 7.04% | $3,496 | -0.68 % | 9,679,235 |
| 2002 | $14,594,249,023 | $31,611,178,874 | 5.05% | $3,244 | -0.67 % | 9,745,923 |
| 2001 | $12,354,820,144 | $30,092,911,067 | 4.73% | $3,067 | -0.61 % | 9,811,401 |
| 2000 | $12,736,856,828 | $28,735,090,128 | 5.80% | $2,911 | -0.53 % | 9,871,632 |
| 1999 | $12,138,486,532 | $27,159,819,639 | 3.40% | $2,737 | -0.46 % | 9,924,437 |
| 1998 | $15,222,012,660 | $26,266,750,353 | 8.40% | $2,635 | -0.39 % | 9,969,987 |
| 1997 | $14,128,408,566 | $24,231,321,395 | 11.40% | $2,421 | -0.35 % | 10,009,394 |
| 1996 | $14,756,846,154 | $21,751,633,937 | 2.80% | $2,165 | -0.33 % | 10,044,853 |
| 1995 | $13,972,676,841 | $21,159,176,014 | -10.40% | $2,100 | -0.30 % | 10,077,608 |
| 1994 | $14,932,024,169 | $23,615,151,942 | -11.70% | $2,336 | -0.26 % | 10,108,291 |