GDP of Croatia
| GDP nominal (2017) | GDP growth rate (2017) |
|---|---|
$55,213,087,271 |
2.92% |
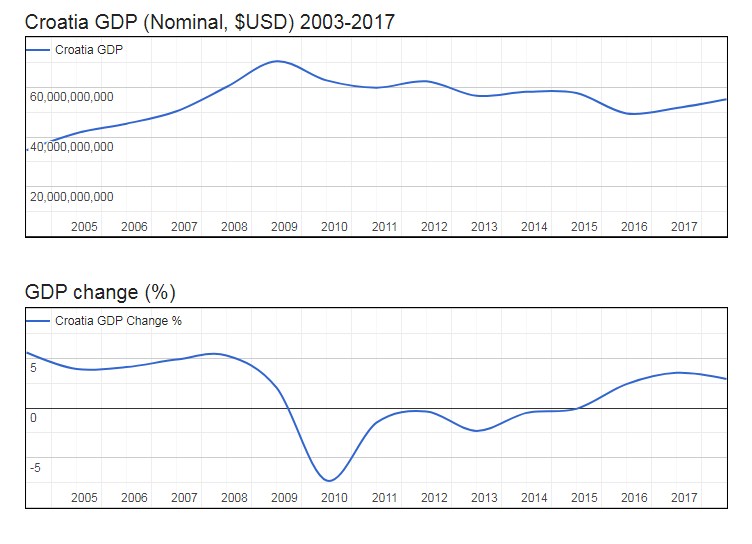
- Nominal (current) Gross Domestic Product (GDP of Croatia is $55,213,087,271 (USD) as of 2017.
- Real GDP (constant, inflation adjusted) of Croatia reached $63,213,911,836 in 2017.
- GDP Growth Rate in 2017 was 2.92%, representing a change of 1,794,290,332 US$ over 2016, when Real GDP was $61,419,621,504.
- GDP per Capita in Croatia (with a population of 4,182,857 people in 2017) was $15,113, an increase of $519 from $14,594 in 2016; this represents a change of 3.6% in GDP per capita.
Gross Domestic Product (GDP of Croatia
| Year | GDP Nominal (Current USD) |
GDP Real (Inflation adj.) |
GDP change |
GDP per capita | Pop. change |
Population |
|---|---|---|---|---|---|---|
| 2017 | $55,213,087,271 | $63,213,911,836 | 2.92% | $15,113 | -0.61 % | 4,182,857 |
| 2016 | $51,640,880,494 | $61,419,621,504 | 3.54% | $14,594 | -0.57 % | 4,208,602 |
| 2015 | $49,490,142,433 | $59,321,921,508 | 2.40% | $14,015 | -0.53 % | 4,232,874 |
| 2014 | $57,671,307,487 | $57,931,229,124 | -0.09% | $13,613 | -0.49 % | 4,255,512 |
| 2013 | $58,147,688,052 | $57,981,971,089 | -0.49% | $13,558 | -0.45 % | 4,276,598 |
| 2012 | $56,548,374,546 | $58,268,505,768 | -2.30% | $13,564 | -0.40 % | 4,295,878 |
| 2011 | $62,404,149,310 | $59,640,623,501 | -0.34% | $13,828 | -0.35 % | 4,313,099 |
| 2010 | $59,844,207,749 | $59,844,207,749 | -1.47% | $13,827 | -0.30 % | 4,328,165 |
| 2009 | $62,754,161,039 | $60,738,840,026 | -7.29% | $13,991 | -0.26 % | 4,341,264 |
| 2008 | $70,474,602,564 | $65,515,885,554 | 2.04% | $15,052 | -0.22 % | 4,352,636 |
| 2007 | $60,093,896,109 | $64,208,308,636 | 5.28% | $14,718 | -0.19 % | 4,362,426 |
| 2006 | $50,375,095,636 | $60,986,019,309 | 4.87% | $13,953 | -0.17 % | 4,370,777 |
| 2005 | $45,347,181,466 | $58,155,133,555 | 4.11% | $13,283 | -0.13 % | 4,378,058 |
| 2004 | $41,523,418,158 | $55,859,549,093 | 3.91% | $12,742 | -0.11 % | 4,383,882 |