GDP of Denmark
| GDP nominal (2017) | GDP growth rate (2017) |
|---|---|
$329,865,537,183 |
2.24% |
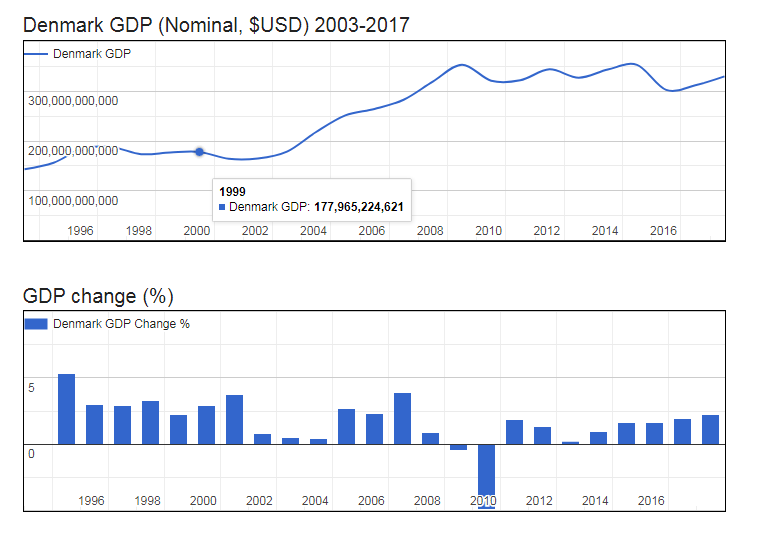
- Nominal (current) Gross Domestic Product (GDP of Denmark is $329,865,537,183 (USD) as of 2017.
- Real GDP (constant, inflation adjusted) of Denmark reached $359,485,426,492 in 2017.
- GDP Growth Rate in 2017 was 2.24%, representing a change of 7,952,952,263 US$ over 2016, when Real GDP was $351,532,474,229.
- GDP per Capita in Denmark (with a population of 5,732,274 people) was $62,713 in 2017, an increase of $1,163 from $61,550 in 2016; this represents a change of 1.9% in GDP per capita.
Gross Domestic Product (GDP of Denmark
| Year | GDP Nominal (Current USD) |
GDP Real (Inflation adj.) |
GDP change |
GDP per capita | Pop. change |
Population |
|---|---|---|---|---|---|---|
| 2017 | $329,865,537,183 | $359,485,426,492 | 2.24% | $62,713 | 0.37 % | 5,732,274 |
| 2016 | $311,988,101,662 | $351,532,474,229 | 1.96% | $61,550 | 0.40 % | 5,711,349 |
| 2015 | $302,673,037,999 | $343,294,497,317 | 1.61% | $60,347 | 0.43 % | 5,688,695 |
| 2014 | $352,993,633,221 | $335,436,494,001 | 1.62% | $59,220 | 0.46 % | 5,664,196 |
| 2013 | $343,584,385,594 | $330,091,081,645 | 0.93% | $58,546 | 0.49 % | 5,638,145 |
| 2012 | $327,148,899,962 | $327,038,668,581 | 0.23% | $58,286 | 0.50 % | 5,610,903 |
| 2011 | $344,003,209,696 | $326,299,702,618 | 1.34% | $58,445 | 0.51 % | 5,582,978 |
| 2010 | $321,995,350,347 | $321,995,350,347 | 1.87% | $57,967 | 0.51 % | 5,554,844 |
| 2009 | $321,241,396,034 | $316,081,488,956 | -4.91% | $57,195 | 0.52 % | 5,526,388 |
| 2008 | $353,361,056,080 | $332,390,304,183 | -0.51% | $60,460 | 0.51 % | 5,497,729 |
| 2007 | $319,423,370,134 | $334,100,985,495 | 0.91% | $61,080 | 0.47 % | 5,469,921 |
| 2006 | $282,884,912,894 | $331,090,534,888 | 3.91% | $60,814 | 0.42 % | 5,444,286 |
| 2005 | $264,467,308,109 | $318,622,884,652 | 2.34% | $58,768 | 0.35 % | 5,421,702 |
| 2004 | $251,373,036,671 | $311,347,732,738 | 2.67% | $57,628 | 0.29 % | 5,402,761 |
| 2003 | $218,095,997,085 | $303,256,268,809 | 0.39% | $56,294 | 0.26 % | 5,386,968 |
| 2002 | $178,635,160,297 | $302,077,941,706 | 0.47% | $56,224 | 0.28 % | 5,372,801 |
| 2001 | $164,791,416,350 | $300,675,755,569 | 0.82% | $56,117 | 0.32 % | 5,358,062 |
| 2000 | $164,158,800,460 | $298,220,951,890 | 3.75% | $55,834 | 0.36 % | 5,341,194 |
| 1999 | $177,965,224,621 | $287,450,469,633 | 2.95% | $54,014 | 0.40 % | 5,321,774 |
| 1998 | $176,992,000,955 | $279,219,071,581 | 2.22% | $52,679 | 0.43 % | 5,300,379 |
| 1997 | $173,537,588,008 | $273,159,941,857 | 3.26% | $51,757 | 0.43 % | 5,277,711 |
| 1996 | $187,632,400,366 | $264,533,812,227 | 2.90% | $50,341 | 0.42 % | 5,254,860 |
| 1995 | $185,006,961,302 | $257,078,363,998 | 3.03% | $49,129 | 0.41 % | 5,232,704 |
| 1994 | $156,162,311,732 | $249,523,699,453 | 5.33% | $47,881 | 0.40 % | 5,211,334 |