GDP of Eswatini
| GDP nominal (2017) | GDP growth rate (2017) |
|---|---|
$4,433,664,364 |
1.87% |
- Nominal (current) Gross Domestic Product (GDP of Eswatini is $4,433,664,364 (USD) as of 2017.
- Real GDP (constant, inflation adjusted) of the Kingdom of Eswatini reached $5,442,504,423 in 2017.
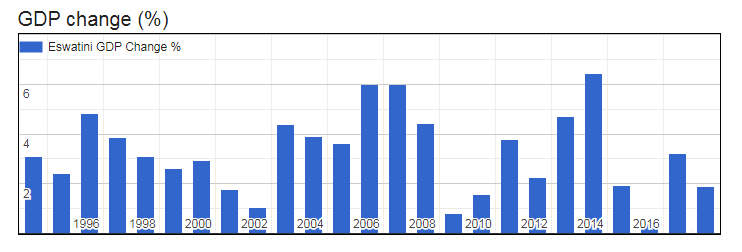
- GDP Growth Rate in 2017 was 1.87%, representing a change of 100,066,761 US$ over 2016, when Real GDP was $5,342,437,662.
- GDP per Capita in the Kingdom of Eswatini (with a population of 1,124,805 people) was $4,839 in 2017, an increase of $43 from $4,796 in 2016; this represents a change of 0.9% in GDP per capita.

Gross Domestic Product (GDP) of Eswatini
| Year | GDP Nominal (Current USD) |
GDP Real (Inflation adj.) |
GDP change |
GDP per capita | Pop. change |
Population |
|---|---|---|---|---|---|---|
| 2017 | $4,433,664,364 | $5,442,504,423 | 1.87% | $4,839 | 0.97 % | 1,124,805 |
| 2016 | $3,817,430,000 | $5,342,437,662 | 3.22% | $4,796 | 0.90 % | 1,113,997 |
| 2015 | $4,020,275,298 | $5,175,653,651 | 0.39% | $4,688 | 0.82 % | 1,104,044 |
| 2014 | $4,377,293,816 | $5,155,489,045 | 1.93% | $4,708 | 0.75 % | 1,095,019 |
| 2013 | $4,560,713,074 | $5,057,821,995 | 6.42% | $4,654 | 0.70 % | 1,086,843 |
| 2012 | $4,823,831,657 | $4,752,652,121 | 4.72% | $4,404 | 0.68 % | 1,079,288 |
| 2011 | $4,820,499,924 | $4,538,527,974 | 2.25% | $4,234 | 0.68 % | 1,072,033 |
| 2010 | $4,438,778,424 | $4,438,778,424 | 3.79% | $4,169 | 0.70 % | 1,064,837 |
| 2009 | $3,580,417,067 | $4,276,537,086 | 1.57% | $4,044 | 0.72 % | 1,057,467 |
| 2008 | $3,294,093,485 | $4,210,638,536 | 0.82% | $4,010 | 0.70 % | 1,049,945 |
| 2007 | $3,469,363,996 | $4,176,323,195 | 4.44% | $4,005 | 0.63 % | 1,042,652 |
| 2006 | $3,291,353,836 | $3,998,954,542 | 5.99% | $3,860 | 0.53 % | 1,036,092 |
| 2005 | $3,178,126,492 | $3,772,877,432 | 6.00% | $3,661 | 0.42 % | 1,030,579 |
| 2004 | $2,770,082,792 | $3,559,359,414 | 3.62% | $3,468 | 0.34 % | 1,026,286 |
| 2003 | $2,197,612,701 | $3,434,882,228 | 3.88% | $3,358 | 0.37 % | 1,022,802 |
| 2002 | $1,432,228,125 | $3,306,579,867 | 4.38% | $3,245 | 0.54 % | 1,019,059 |
| 2001 | $1,542,477,309 | $3,167,825,952 | 1.05% | $3,125 | 0.81 % | 1,013,609 |
| 2000 | $1,738,100,853 | $3,134,761,586 | 1.76% | $3,118 | 1.14 % | 1,005,435 |
| 1999 | $1,547,884,442 | $3,080,538,752 | 2.95% | $3,099 | 1.45 % | 994,108 |
| 1998 | $1,576,904,292 | $2,992,241,441 | 2.60% | $3,054 | 1.71 % | 979,918 |
| 1997 | $1,716,699,913 | $2,916,299,844 | 3.10% | $3,027 | 1.90 % | 963,426 |
| 1996 | $1,602,760,100 | $2,828,535,881 | 3.84% | $2,992 | 2.01 % | 945,508 |
| 1995 | $1,698,982,438 | $2,723,882,841 | 4.83% | $2,939 | 2.12 % | 926,841 |
| 1994 | $1,419,293,455 | $2,598,488,825 | 2.40% | $2,863 | 2.24 % | 907,620 |