GDP of France
| GDP nominal (2017) | GDP growth rate (2017) |
|---|---|
$2,582,501,307,216 |
1.82% |
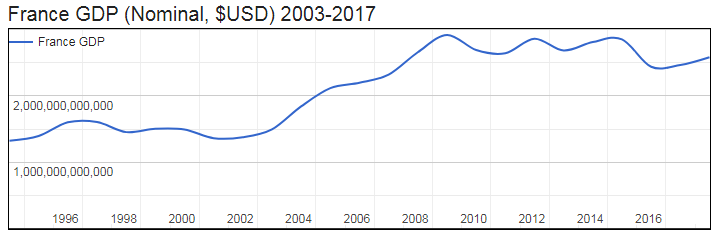
- Nominal (current) Gross Domestic Product (GDP of France is $2,582,501,307,216 (USD) as of 2017.
- Real GDP (constant, inflation adjusted) of France reached $2,874,670,390,657 in 2017.
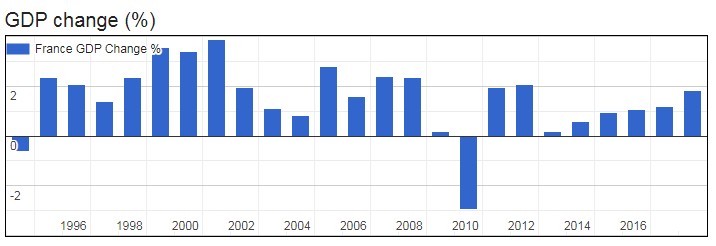
- GDP Growth Rate in 2017 was 1.82%, representing a change of 60,811,929,646 US$ over 2016, when Real GDP was $2,813,858,461,011.
- GDP per Capita in France (with a population of 64,842,509 people) was $44,333 in 2017, an increase of $820 from $43,513 in 2016; this represents a change of 1.9% in GDP per capita.
France Gross Domestic Product (GDP of France
| Year | GDP Nominal (Current USD) |
GDP Real (Inflation adj.) |
GDP change |
GDP per capita | Pop. change |
Population |
|---|---|---|---|---|---|---|
| 2017 | $2,582,501,307,216 | $2,874,670,390,657 | 1.82% | $44,333 | 0.27 % | 64,842,509 |
| 2016 | $2,465,134,297,439 | $2,813,858,461,011 | 1.19% | $43,513 | 0.33 % | 64,667,596 |
| 2015 | $2,438,207,896,252 | $2,781,288,181,539 | 1.07% | $43,152 | 0.40 % | 64,453,200 |
| 2014 | $2,852,165,760,630 | $2,750,675,573,589 | 0.95% | $42,850 | 0.47 % | 64,193,550 |
| 2013 | $2,811,077,725,704 | $2,724,623,188,697 | 0.58% | $42,643 | 0.52 % | 63,893,525 |
| 2012 | $2,683,825,225,093 | $2,709,010,438,795 | 0.18% | $42,618 | 0.54 % | 63,564,221 |
| 2011 | $2,861,408,170,265 | $2,700,554,065,723 | 2.08% | $42,715 | 0.55 % | 63,222,227 |
| 2010 | $2,642,609,548,930 | $2,642,609,548,930 | 1.97% | $42,027 | 0.54 % | 62,879,530 |
| 2009 | $2,690,222,283,968 | $2,591,666,269,727 | -2.94% | $41,438 | 0.54 % | 62,542,900 |
| 2008 | $2,918,382,891,460 | $2,670,206,139,233 | 0.20% | $42,923 | 0.55 % | 62,209,207 |
| 2007 | $2,657,213,249,384 | $2,665,001,530,700 | 2.36% | $43,075 | 0.59 % | 61,869,227 |
| 2006 | $2,318,593,651,988 | $2,603,519,448,239 | 2.37% | $42,328 | 0.64 % | 61,508,926 |
| 2005 | $2,196,126,103,718 | $2,543,121,659,233 | 1.61% | $41,609 | 0.70 % | 61,120,127 |
| 2004 | $2,115,742,488,205 | $2,502,882,471,990 | 2.79% | $41,235 | 0.74 % | 60,697,981 |
| 2003 | $1,840,480,812,641 | $2,435,032,149,086 | 0.82% | $40,414 | 0.75 % | 60,251,588 |
| 2002 | $1,494,286,655,374 | $2,415,238,504,667 | 1.12% | $40,386 | 0.71 % | 59,803,441 |
| 2001 | $1,376,465,324,385 | $2,388,523,894,567 | 1.95% | $40,222 | 0.63 % | 59,384,132 |
| 2000 | $1,362,248,940,483 | $2,342,736,298,466 | 3.88% | $39,697 | 0.53 % | 59,015,096 |
| 1999 | $1,492,647,560,196 | $2,255,338,280,605 | 3.41% | $38,419 | 0.45 % | 58,704,381 |
| 1998 | $1,503,108,739,159 | $2,181,028,477,921 | 3.56% | $37,318 | 0.38 % | 58,444,246 |
| 1997 | $1,452,884,917,959 | $2,106,130,247,622 | 2.34% | $36,175 | 0.36 % | 58,220,659 |
| 1996 | $1,605,675,086,550 | $2,058,027,288,316 | 1.39% | $35,476 | 0.36 % | 58,012,058 |
| 1995 | $1,601,094,756,210 | $2,029,852,848,974 | 2.09% | $35,117 | 0.37 % | 57,801,892 |
| 1994 | $1,393,982,750,473 | $1,988,393,170,557 | 2.35% | $34,528 | 0.38 % | 57,587,131 |