GDP of United Kingdom
| GDP nominal (2017) | GDP growth rate (2017) |
|---|---|
$2,637,866,340,434 |
1.79% |
- Nominal (current) Gross Domestic Product (GDP of United Kingdom is $2,637,866,340,434 (USD) as of 2017.
- Real GDP (constant, inflation adjusted) of the United Kingdom reached $2,818,703,538,385 in 2017.
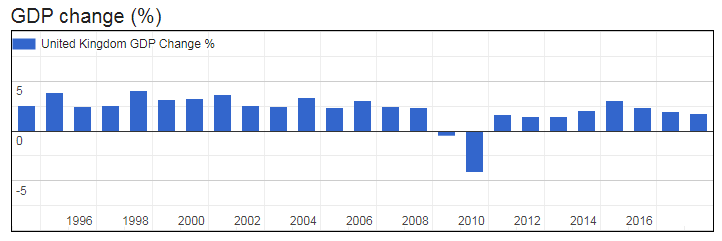
- GDP Growth Rate in 2017 was 1.79%, representing a change of 50,463,025,163 US$ over 2016, when Real GDP was $2,768,240,513,222.
- GDP per Capita in the United Kingdom (with a population of 66,727,461 people) was $42,242 in 2017, an increase of $487 from $41,755 in 2016; this represents a change of 1.2% in GDP per capita.
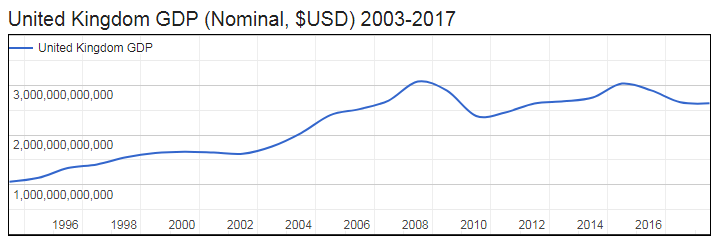
United Kingdom Gross Domestic Product (GDP of United Kingdom
| Year | GDP Nominal (Current USD) |
GDP Real (Inflation adj.) |
GDP change |
GDP per capita | Pop. change |
Population |
|---|---|---|---|---|---|---|
| 2017 | $2,637,866,340,434 | $2,818,703,538,385 | 1.79% | $42,242 | 0.65 % | 66,727,461 |
| 2016 | $2,659,238,931,670 | $2,768,240,513,222 | 1.94% | $41,755 | 0.66 % | 66,297,944 |
| 2015 | $2,896,420,586,534 | $2,719,580,793,136 | 2.35% | $41,293 | 0.67 % | 65,860,146 |
| 2014 | $3,034,729,456,047 | $2,657,160,857,647 | 3.05% | $40,615 | 0.68 % | 65,423,047 |
| 2013 | $2,753,565,033,774 | $2,581,081,905,286 | 2.05% | $39,719 | 0.71 % | 64,984,018 |
| 2012 | $2,676,605,417,646 | $2,529,322,974,273 | 1.48% | $39,199 | 0.79 % | 64,525,312 |
| 2011 | $2,634,895,693,131 | $2,493,244,223,367 | 1.45% | $38,944 | 0.89 % | 64,021,919 |
| 2010 | $2,452,899,665,124 | $2,452,899,665,124 | 1.69% | $38,653 | 1.00 % | 63,459,808 |
| 2009 | $2,382,825,985,356 | $2,400,495,860,781 | -4.19% | $38,207 | 1.10 % | 62,828,616 |
| 2008 | $2,890,564,338,235 | $2,505,416,684,453 | -0.47% | $40,316 | 1.12 % | 62,145,097 |
| 2007 | $3,074,359,743,898 | $2,517,311,998,562 | 2.36% | $40,962 | 1.04 % | 61,455,162 |
| 2006 | $2,692,612,695,492 | $2,459,352,241,877 | 2.46% | $40,436 | 0.88 % | 60,821,356 |
| 2005 | $2,520,701,818,182 | $2,400,398,463,977 | 3.10% | $39,816 | 0.69 % | 60,287,954 |
| 2004 | $2,398,555,474,185 | $2,328,311,858,123 | 2.36% | $38,888 | 0.52 % | 59,872,753 |
| 2003 | $2,038,395,102,041 | $2,274,531,574,900 | 3.33% | $38,188 | 0.40 % | 59,561,432 |
| 2002 | $1,768,408,273,381 | $2,201,317,743,024 | 2.46% | $37,105 | 0.34 % | 59,326,294 |
| 2001 | $1,621,510,004,318 | $2,148,509,996,710 | 2.54% | $36,339 | 0.34 % | 59,124,288 |
| 2000 | $1,647,951,278,560 | $2,095,205,239,633 | 3.66% | $35,558 | 0.35 % | 58,923,309 |
| 1999 | $1,665,623,685,488 | $2,021,147,778,546 | 3.22% | $34,423 | 0.35 % | 58,715,854 |
| 1998 | $1,638,511,096,390 | $1,958,159,190,329 | 3.14% | $33,467 | 0.35 % | 58,509,974 |
| 1997 | $1,552,483,628,029 | $1,898,585,223,137 | 4.04% | $32,562 | 0.33 % | 58,307,313 |
| 1996 | $1,408,781,591,264 | $1,824,891,568,314 | 2.54% | $31,402 | 0.31 % | 58,113,557 |
| 1995 | $1,335,218,557,677 | $1,779,710,859,442 | 2.47% | $30,720 | 0.29 % | 57,932,453 |
| 1994 | $1,140,489,745,944 | $1,736,816,113,510 | 3.88% | $30,068 | 0.28 % | 57,763,378 |