GDP of Greece
| GDP nominal (2017) | GDP growth rate (2017) |
|---|---|
$203,085,551,429 |
1.35% |
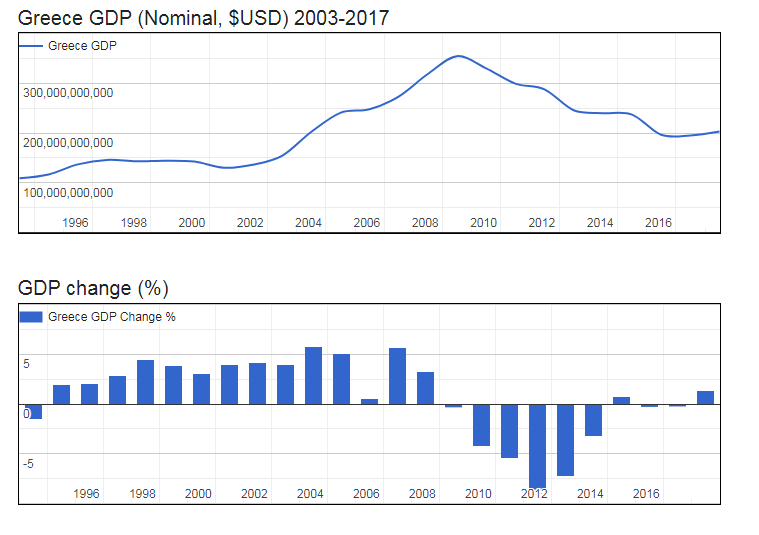
- Nominal (current) Gross Domestic Product (GDP of Greece is $203,085,551,429 (USD) as of 2017.
- Real GDP (constant, inflation adjusted) of Greece reached $247,927,466,976 in 2017.
- GDP Growth Rate in 2017 was 1.35%, representing a change of 3,676,223,770 US$ over 2016, when Real GDP was $244,251,243,206.
- GDP per Capita in Greece (with a population of 10,569,450 people) was $23,457 in 2017, an increase of $447 from $23,010 in 2016; this represents a change of 1.9% in GDP per capita.
Gross Domestic Product (GDP of Greece
| Year | GDP Nominal (Current USD) |
GDP Real (Inflation adj.) |
GDP change |
GDP per capita | Pop. change |
Population |
|---|---|---|---|---|---|---|
| 2017 | $203,085,551,429 | $247,927,466,976 | 1.35% | $23,457 | -0.43 % | 10,569,450 |
| 2016 | $195,222,443,513 | $244,251,243,206 | -0.24% | $23,010 | -0.42 % | 10,615,185 |
| 2015 | $196,591,353,761 | $244,718,538,827 | -0.29% | $22,957 | -0.39 % | 10,659,750 |
| 2014 | $237,029,579,261 | $245,794,711,442 | 0.74% | $22,968 | -0.36 % | 10,701,456 |
| 2013 | $239,862,011,450 | $243,989,731,227 | -3.24% | $22,717 | -0.38 % | 10,740,500 |
| 2012 | $245,670,666,639 | $252,163,419,407 | -7.30% | $23,389 | -0.44 % | 10,781,125 |
| 2011 | $287,797,822,093 | $272,022,398,082 | -9.13% | $25,120 | -0.54 % | 10,829,079 |
| 2010 | $299,361,576,558 | $299,361,576,558 | -5.48% | $27,496 | -0.65 % | 10,887,637 |
| 2009 | $330,000,252,153 | $316,714,480,469 | -4.30% | $28,899 | -0.73 % | 10,959,272 |
| 2008 | $354,460,802,549 | $330,947,657,807 | -0.34% | $29,976 | -0.72 % | 11,040,309 |
| 2007 | $318,497,936,901 | $332,060,633,926 | 3.27% | $29,861 | -0.58 % | 11,120,358 |
| 2006 | $273,317,737,047 | $321,534,411,243 | 5.65% | $28,746 | -0.35 % | 11,185,228 |
| 2005 | $247,783,001,865 | $304,332,233,458 | 0.60% | $27,113 | -0.09 % | 11,224,791 |
| 2004 | $240,521,260,988 | $302,519,710,645 | 5.06% | $26,927 | 0.14 % | 11,234,992 |
| 2003 | $201,924,270,316 | $287,946,747,180 | 5.79% | $25,666 | 0.33 % | 11,218,884 |
| 2002 | $153,830,947,017 | $272,175,455,327 | 3.92% | $24,340 | 0.43 % | 11,182,305 |
| 2001 | $136,191,353,468 | $261,901,399,087 | 4.13% | $23,522 | 0.47 % | 11,134,457 |
| 2000 | $130,133,845,771 | $251,509,982,286 | 3.92% | $22,695 | 0.49 % | 11,082,104 |
| 1999 | $142,540,728,958 | $242,023,226,589 | 3.07% | $21,946 | 0.53 % | 11,027,900 |
| 1998 | $144,428,172,835 | $234,808,508,199 | 3.89% | $21,404 | 0.59 % | 10,970,121 |
| 1997 | $143,157,600,025 | $226,005,797,602 | 4.48% | $20,723 | 0.68 % | 10,906,257 |
| 1996 | $145,861,612,826 | $216,306,196,962 | 2.86% | $19,969 | 0.81 % | 10,832,141 |
| 1995 | $136,878,366,230 | $210,287,497,826 | 2.10% | $19,570 | 0.94 % | 10,745,503 |
| 1994 | $116,601,802,107 | $205,962,855,046 | 2.00% | $19,348 | 1.06 % | 10,644,949 |