GDP of New Zealand
| GDP nominal (2017) | GDP growth rate (2017) |
|---|---|
$204,139,049,909 |
3.03% |
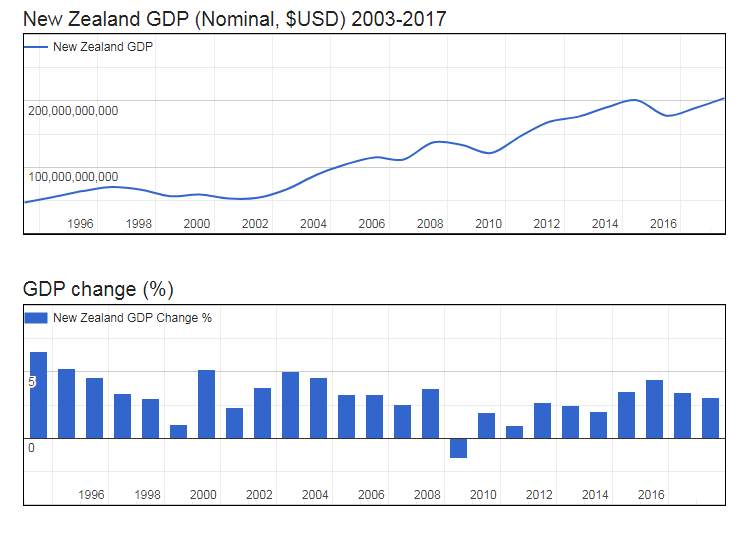
- Nominal (current) Gross Domestic Product (GDP) of New Zealand is $204,139,049,909 (USD) as of 2017.
- Real GDP (constant, inflation adjusted) of New Zealand reached $181,094,413,097 in 2017.
- GDP Growth Rate in 2017 was 3.03%, representing a change of 4,965,852,440 US$ over 2016, when Real GDP was $176,128,560,657.
- GDP per Capita in New Zealand (with a population of 4,702,034 people) was $38,514 in 2017, an increase of $712 from $37,802 in 2016; this represents a change of 1.9% in GDP per capita.
Gross Domestic Product (GDP of New Zealand
| Year | GDP Nominal (Current USD) |
GDP Real (Inflation adj.) |
GDP change |
GDP per capita | Pop. change |
Population |
|---|---|---|---|---|---|---|
| 2017 | $204,139,049,909 | $181,094,413,097 | 3.03% | $38,514 | 0.92 % | 4,702,034 |
| 2016 | $189,285,950,471 | $176,128,560,657 | 3.47% | $37,802 | 0.97 % | 4,659,265 |
| 2015 | $177,620,948,761 | $170,219,465,391 | 4.43% | $36,888 | 1.03 % | 4,614,532 |
| 2014 | $200,955,119,874 | $162,991,922,800 | 3.54% | $35,685 | 1.08 % | 4,567,527 |
| 2013 | $190,785,204,764 | $157,411,691,834 | 2.02% | $34,837 | 1.12 % | 4,518,515 |
| 2012 | $176,192,886,551 | $154,297,943,910 | 2.50% | $34,530 | 1.13 % | 4,468,457 |
| 2011 | $168,461,998,741 | $150,535,436,255 | 2.70% | $34,068 | 1.11 % | 4,418,678 |
| 2010 | $146,583,831,538 | $146,583,831,538 | 0.96% | $33,543 | 1.08 % | 4,370,062 |
| 2009 | $121,338,622,025 | $145,186,905,292 | 1.92% | $33,582 | 1.06 % | 4,323,337 |
| 2008 | $133,279,679,483 | $142,457,330,738 | -1.55% | $33,299 | 1.07 % | 4,278,155 |
| 2007 | $137,316,087,308 | $144,693,608,698 | 3.76% | $34,182 | 1.13 % | 4,233,046 |
| 2006 | $111,608,845,081 | $139,449,716,342 | 2.57% | $33,314 | 1.22 % | 4,185,888 |
| 2005 | $114,718,721,397 | $135,951,795,047 | 3.32% | $32,875 | 1.35 % | 4,135,355 |
| 2004 | $103,904,537,815 | $131,584,625,304 | 3.27% | $32,248 | 1.45 % | 4,080,438 |
| 2003 | $88,250,885,550 | $127,418,511,260 | 4.54% | $31,680 | 1.49 % | 4,022,069 |
| 2002 | $66,627,729,311 | $121,884,620,353 | 5.06% | $30,754 | 1.41 % | 3,963,206 |
| 2001 | $53,872,425,917 | $116,013,643,412 | 3.80% | $29,687 | 1.27 % | 3,907,933 |
| 2000 | $52,622,842,840 | $111,769,050,448 | 2.29% | $28,963 | 1.07 % | 3,858,999 |
| 1999 | $58,762,260,626 | $109,267,438,706 | 5.19% | $28,618 | 0.90 % | 3,818,131 |
| 1998 | $56,227,696,195 | $103,872,567,756 | 1.07% | $27,451 | 0.84 % | 3,783,974 |
| 1997 | $66,074,513,018 | $102,776,851,346 | 3.01% | $27,390 | 0.94 % | 3,752,362 |
| 1996 | $70,140,835,299 | $99,775,216,339 | 3.36% | $26,840 | 1.15 % | 3,717,349 |
| 1995 | $63,918,039,320 | $96,533,659,742 | 4.58% | $26,268 | 1.43 % | 3,674,936 |
| 1994 | $55,154,160,816 | $92,308,499,652 | 5.22% | $25,477 | 1.65 % | 3,623,279 |