GDP of Marshall Islands
| GDP nominal (2017) | GDP growth rate (2017) |
|---|---|
$204,173,430 |
3.60% |
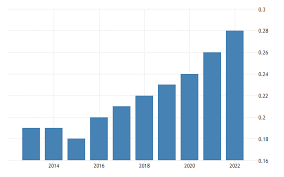
- Nominal (current) Gross Domestic Product (GDP) of the Marshall Islands is $204,173,430 (USD) as of 2017.
- Real GDP (constant, inflation adjusted) of the Marshall Islands reached $185,487,298 in 2017.
- GDP Growth Rate in 2017 was 3.60%, representing a change of 6,445,504 US$ over 2016, when Real GDP was $179,041,794.
- GDP per Capita in the Marshall Islands (with a population of 58,058 people) was $3,195 in 2017, an increase of $94 from $3,101 in 2016; this represents a change of 3.0% in GDP per capita.
Gross Domestic Product (GDP of Marshall Islands
| Year | GDP Nominal (Current USD) |
GDP Real (Inflation adj.) |
GDP change |
GDP per capita | Pop. change |
Population |
|---|---|---|---|---|---|---|
| 2017 | $204,173,430 | $185,487,298 | 3.60% | $3,195 | 0.56 % | 58,058 |
| 2016 | $194,497,900 | $179,041,794 | 1.91% | $3,101 | 0.52 % | 57,735 |
| 2015 | $179,697,900 | $175,685,334 | -0.36% | $3,059 | 0.45 % | 57,439 |
| 2014 | $183,121,300 | $176,328,133 | -0.76% | $3,084 | 0.42 % | 57,179 |
| 2013 | $190,800,800 | $177,673,016 | 2.86% | $3,120 | 0.39 % | 56,938 |
| 2012 | $185,210,500 | $172,732,723 | 3.46% | $3,046 | 0.33 % | 56,717 |
| 2011 | $173,260,300 | $166,959,486 | 1.21% | $2,953 | 0.29 % | 56,531 |
| 2010 | $164,969,100 | $164,969,100 | 6.45% | $2,927 | 0.21 % | 56,366 |
| 2009 | $152,617,500 | $154,968,025 | -1.64% | $2,755 | 0.14 % | 56,250 |
| 2008 | $152,788,700 | $157,545,417 | -1.64% | $2,805 | 0.22 % | 56,174 |
| 2007 | $150,776,500 | $160,180,180 | 3.65% | $2,858 | 0.51 % | 56,051 |
| 2006 | $143,930,000 | $154,534,759 | 1.44% | $2,771 | 0.92 % | 55,767 |
| 2005 | $137,928,600 | $152,345,999 | 2.92% | $2,757 | 1.44 % | 55,258 |
| 2004 | $131,334,600 | $148,030,245 | 0.12% | $2,717 | 1.91 % | 54,476 |
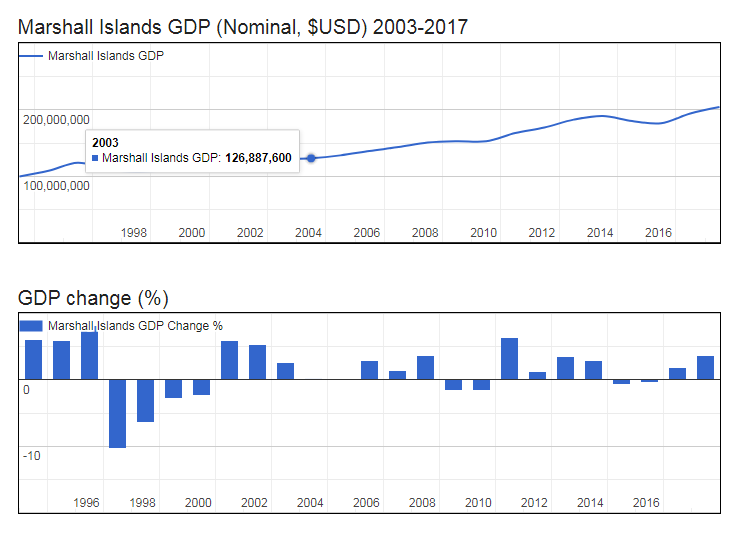
| 2003 | $126,887,600 | $147,854,977 | 0.17% | $2,766 | 2.07 % | 53,456 |
| 2002 | $124,735,100 | $147,603,854 | 2.62% | $2,818 | 1.84 % | 52,370 |
| 2001 | $115,152,100 | $143,841,180 | 5.36% | $2,797 | 1.32 % | 51,422 |
| 2000 | $110,937,700 | $136,519,164 | 5.89% | $2,690 | 0.65 % | 50,753 |
| 1999 | $107,978,900 | $128,924,609 | -2.40% | $2,557 | 0.13 % | 50,423 |
| 1998 | $108,702,100 | $132,091,036 | -2.84% | $2,623 | -0.19 % | 50,356 |
| 1997 | $106,289,100 | $135,957,969 | -6.45% | $2,695 | -0.16 % | 50,450 |
| 1996 | $110,858,000 | $145,325,150 | -10.30% | $2,876 | 0.15 % | 50,533 |
| 1995 | $120,230,000 | $162,017,728 | 8.21% | $3,211 | 0.48 % | 50,457 |
| 1994 | $108,071,000 | $149,720,817 | 5.88% | $2,982 | 0.77 % | 50,215 |
GDP of Marshall Islands 2023 and 2024