GDP of Nigeria
| GDP nominal (2017) | GDP growth rate (2017) |
|---|---|
$375,745,486,521 |
0.81% |
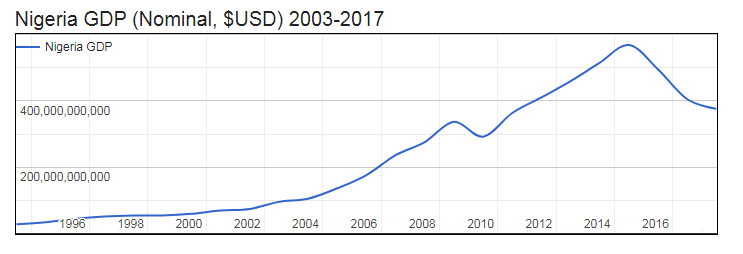
- Nominal (current) Gross Domestic Product : GDP of Nigeria is $375,745,486,521 (USD) as of 2017.
- Real GDP (constant, inflation adjusted) of Nigeria reached $460,456,500,519 in 2017.
- GDP Growth Rate in 2017 was 0.81%, representing a change of 3,681,091,900 US$ over 2016, when Real GDP was $456,775,408,619.
- GDP per Capita in Nigeria (with a population of 190,873,244 people) was $2,412 in 2017, a decrease of $44 from $2,456 in 2016; this represents a change of -1.8% in GDP per capita.

Gross Domestic Product (GDP of Nigeria
| Year | GDP Nominal (Current USD) |
GDP Real (Inflation adj.) |
GDP change |
GDP per capita | Pop. change |
Population |
|---|---|---|---|---|---|---|
| 2017 | $375,745,486,521 | $460,456,500,519 | 0.81% | $2,412 | 2.64 % | 190,873,244 |
| 2016 | $404,649,527,538 | $456,775,408,619 | -1.62% | $2,456 | 2.66 % | 185,960,241 |
| 2015 | $494,583,180,777 | $464,282,244,064 | 2.65% | $2,563 | 2.68 % | 181,137,448 |
| 2014 | $568,498,937,616 | $452,284,522,850 | 6.31% | $2,564 | 2.70 % | 176,404,934 |
| 2013 | $514,966,287,334 | $425,440,428,748 | 6.67% | $2,477 | 2.71 % | 171,765,816 |
| 2012 | $459,376,049,764 | $398,832,945,309 | 4.23% | $2,385 | 2.72 % | 167,228,794 |
| 2011 | $410,334,579,161 | $382,646,753,550 | 5.31% | $2,350 | 2.71 % | 162,805,077 |
| 2010 | $363,359,886,203 | $363,359,886,203 | 8.01% | $2,292 | 2.71 % | 158,503,197 |
| 2009 | $291,880,204,328 | $336,426,720,549 | 8.04% | $2,180 | 2.70 % | 154,324,933 |
| 2008 | $337,035,512,677 | $311,399,755,437 | 6.76% | $2,072 | 2.69 % | 150,269,623 |
| 2007 | $275,625,684,969 | $291,669,829,237 | 6.59% | $1,993 | 2.67 % | 146,339,977 |
| 2006 | $236,103,982,432 | $273,634,239,782 | 6.06% | $1,920 | 2.65 % | 142,538,308 |
| 2005 | $176,134,087,151 | $258,000,863,158 | 6.44% | $1,858 | 2.62 % | 138,865,016 |
| 2004 | $136,385,979,323 | $242,394,268,148 | 9.25% | $1,791 | 2.59 % | 135,320,422 |
| 2003 | $104,911,947,834 | $221,870,049,983 | 7.35% | $1,682 | 2.57 % | 131,900,631 |
| 2002 | $95,385,819,321 | $206,684,534,276 | 15.33% | $1,607 | 2.55 % | 128,596,076 |
| 2001 | $74,030,364,472 | $179,212,735,022 | 5.92% | $1,429 | 2.54 % | 125,394,046 |
| 2000 | $69,448,756,933 | $169,200,011,888 | 5.02% | $1,384 | 2.54 % | 122,283,850 |
| 1999 | $59,372,613,486 | $161,118,417,199 | 0.58% | $1,351 | 2.53 % | 119,260,063 |
| 1998 | $54,604,050,168 | $160,182,746,695 | 2.58% | $1,377 | 2.52 % | 116,319,759 |
| 1997 | $54,457,835,194 | $156,152,065,108 | 2.94% | $1,376 | 2.52 % | 113,457,663 |
| 1996 | $51,075,815,092 | $151,696,585,573 | 4.20% | $1,371 | 2.52 % | 110,668,794 |
| 1995 | $44,062,465,800 | $145,587,830,775 | -0.07% | $1,349 | 2.52 % | 107,948,335 |
| 1994 | $33,833,042,988 | $145,693,698,761 | -1.81% | $1,384 | 2.52 % | 105,293,700 |