GDP of United Arab Emirates
| GDP nominal (2017) | GDP growth rate (2017) |
|---|---|
$382,575,085,092 |
0.79% |
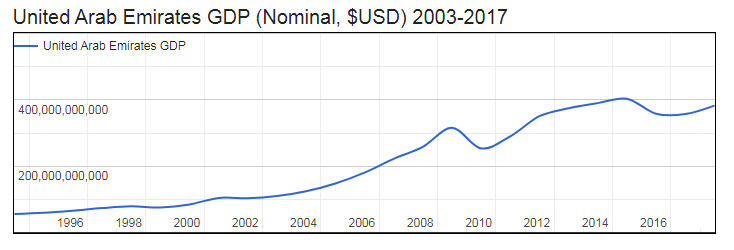
- Nominal (current) Gross Domestic Product GDP of United Arab Emirates is $382,575,085,092 (USD) as of 2017.
- Real GDP (constant, inflation adjusted) of the United Arab Emirates reached $387,259,360,109 in 2017.
- GDP Growth Rate in 2017 was 0.79%, representing a change of 3,036,895,848 US$ over 2016, when Real GDP was $384,222,464,261.
- GDP per Capita in the United Arab Emirates (with a population of 9,487,203 people) was $40,819 in 2017, a decrease of $226 from $41,045 in 2016; this represents a change of -0.6% in GDP per capita.

Gross Domestic Product (GDP of United Arab Emirates
| Year | GDP Nominal (Current USD) |
GDP Real (Inflation adj.) |
GDP change |
GDP per capita | Pop. change |
Population |
|---|---|---|---|---|---|---|
| 2017 | $382,575,085,092 | $387,259,360,109 | 0.79% | $40,819 | 1.35 % | 9,487,203 |
| 2016 | $357,045,064,670 | $384,222,464,261 | 2.99% | $41,045 | 1.06 % | 9,360,980 |
| 2015 | $358,135,057,862 | $373,073,383,254 | 5.06% | $40,276 | 0.53 % | 9,262,900 |
| 2014 | $403,137,100,068 | $355,089,176,310 | 4.40% | $38,537 | 0.18 % | 9,214,175 |
| 2013 | $390,107,556,161 | $340,127,978,216 | 5.05% | $36,979 | 0.62 % | 9,197,910 |
| 2012 | $374,590,605,854 | $323,766,916,270 | 4.48% | $35,417 | 2.18 % | 9,141,596 |
| 2011 | $350,666,031,314 | $309,870,388,019 | 6.93% | $34,635 | 4.64 % | 8,946,777 |
| 2010 | $289,787,338,325 | $289,787,338,325 | 1.60% | $33,893 | 7.99 % | 8,549,988 |
| 2009 | $253,547,358,747 | $285,215,869,952 | -5.24% | $36,024 | 11.68 % | 7,917,372 |
| 2008 | $315,474,615,739 | $300,996,902,491 | 3.19% | $42,457 | 14.92 % | 7,089,487 |
| 2007 | $257,916,133,424 | $291,686,739,333 | 3.18% | $47,284 | 16.39 % | 6,168,838 |
| 2006 | $222,116,541,865 | $282,684,947,638 | 9.84% | $53,335 | 15.52 % | 5,300,174 |
| 2005 | $180,617,018,380 | $257,366,938,870 | 4.86% | $56,093 | 12.77 % | 4,588,225 |
| 2004 | $147,824,370,320 | $245,449,995,044 | 9.57% | $60,328 | 9.61 % | 4,068,570 |
| 2003 | $124,346,358,067 | $224,019,327,978 | 8.80% | $60,351 | 6.70 % | 3,711,932 |
| 2002 | $109,816,201,498 | $205,899,094,159 | 2.43% | $59,187 | 5.33 % | 3,478,777 |
| 2001 | $103,311,640,572 | $201,007,659,578 | 1.40% | $60,861 | 5.38 % | 3,302,719 |
| 2000 | $104,337,372,362 | $198,234,194,636 | 10.85% | $63,252 | 5.67 % | 3,134,062 |
| 1999 | $84,445,473,111 | $178,826,665,568 | 2.90% | $60,292 | 5.43 % | 2,966,034 |
| 1998 | $75,674,336,283 | $173,783,108,482 | 0.29% | $61,774 | 5.31 % | 2,813,214 |
| 1997 | $78,839,008,445 | $173,277,148,999 | 8.19% | $64,865 | 5.21 % | 2,671,362 |
| 1996 | $73,571,233,996 | $160,159,451,464 | 5.80% | $63,077 | 5.14 % | 2,539,126 |
| 1995 | $65,743,666,576 | $151,381,727,243 | 6.69% | $62,682 | 5.26 % | 2,415,090 |
| 1994 | $59,305,093,980 | $141,892,141,892 | 6.90% | $61,843 | 5.58 % | 2,294,385 |