GDP of Norway
| GDP nominal (2017) | GDP growth rate (2017) |
|---|---|
$399,488,897,844 |
1.92% |
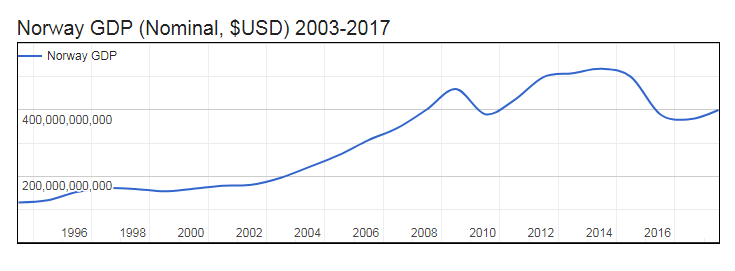
- Nominal (current) Gross Domestic Product (GDP of Norway is $399,488,897,844 (USD) as of 2017.
- Real GDP (constant, inflation adjusted) of Norway reached $482,585,850,269 in 2017.
- GDP Growth Rate in 2017 was 1.92%, representing a change of 9,371,711,441 US$ over 2016, when Real GDP was $473,214,138,828.
- GDP per Capita in Norway (with a population of 5,296,326 people) was $91,117 in 2017, an increase of $997 from $90,120 in 2016; this represents a change of 1.1% in GDP per capita.

Gross Domestic Product (GDP of Norway
| Year | GDP Nominal (Current USD) |
GDP Real (Inflation adj.) |
GDP change |
GDP per capita | Pop. change |
Population |
|---|---|---|---|---|---|---|
| 2017 | $399,488,897,844 | $482,585,850,269 | 1.92% | $91,117 | 0.86 % | 5,296,326 |
| 2016 | $371,344,761,905 | $473,214,138,828 | 1.09% | $90,120 | 0.98 % | 5,250,949 |
| 2015 | $386,663,139,403 | $467,661,339,633 | 1.97% | $89,938 | 1.12 % | 5,199,836 |
| 2014 | $499,338,534,779 | $458,626,161,484 | 1.98% | $89,188 | 1.24 % | 5,142,265 |
| 2013 | $523,502,127,660 | $449,743,204,980 | 1.04% | $88,542 | 1.31 % | 5,079,455 |
| 2012 | $510,229,136,227 | $445,094,684,704 | 2.72% | $88,776 | 1.32 % | 5,013,709 |
| 2011 | $498,831,558,926 | $433,301,826,113 | 0.97% | $87,565 | 1.28 % | 4,948,330 |
| 2010 | $429,130,952,709 | $429,130,952,709 | 0.69% | $87,831 | 1.22 % | 4,885,878 |
| 2009 | $386,622,457,580 | $426,183,200,888 | -1.69% | $88,294 | 1.17 % | 4,826,848 |
| 2008 | $462,554,432,624 | $433,514,113,608 | 0.48% | $90,864 | 1.09 % | 4,771,019 |
| 2007 | $401,082,621,083 | $431,439,784,972 | 2.99% | $91,418 | 0.99 % | 4,719,402 |
| 2006 | $345,424,664,369 | $418,934,364,462 | 2.40% | $89,650 | 0.88 % | 4,672,994 |
| 2005 | $308,722,079,938 | $409,135,198,147 | 2.62% | $88,321 | 0.74 % | 4,632,364 |
| 2004 | $264,357,494,659 | $398,671,193,465 | 3.96% | $86,701 | 0.62 % | 4,598,214 |
| 2003 | $228,752,436,372 | $383,488,728,840 | 0.92% | $83,912 | 0.53 % | 4,570,106 |
| 2002 | $195,418,347,153 | $379,993,390,465 | 1.44% | $83,588 | 0.51 % | 4,546,019 |
| 2001 | $174,003,247,439 | $374,607,623,676 | 2.09% | $82,820 | 0.53 % | 4,523,145 |
| 2000 | $171,315,639,983 | $366,955,399,846 | 3.21% | $81,557 | 0.57 % | 4,499,367 |
| 1999 | $162,286,003,693 | $355,558,728,973 | 2.01% | $79,472 | 0.60 % | 4,474,004 |
| 1998 | $154,165,219,812 | $348,541,516,288 | 2.62% | $78,368 | 0.62 % | 4,447,486 |
| 1997 | $161,354,369,893 | $339,628,321,175 | 5.28% | $76,834 | 0.62 % | 4,420,262 |
| 1996 | $163,517,783,497 | $322,580,935,541 | 5.03% | $73,427 | 0.60 % | 4,393,209 |
| 1995 | $152,027,402,450 | $307,138,048,449 | 4.15% | $70,332 | 0.58 % | 4,366,995 |
| 1994 | $127,131,461,120 | $294,888,524,870 | 5.06% | $67,921 | 0.58 % | 4,341,615 |