GDP of Papua New Guinea
| GDP nominal (2017) | GDP growth rate (2017) |
|---|---|
$20,536,314,601 |
2.55% |
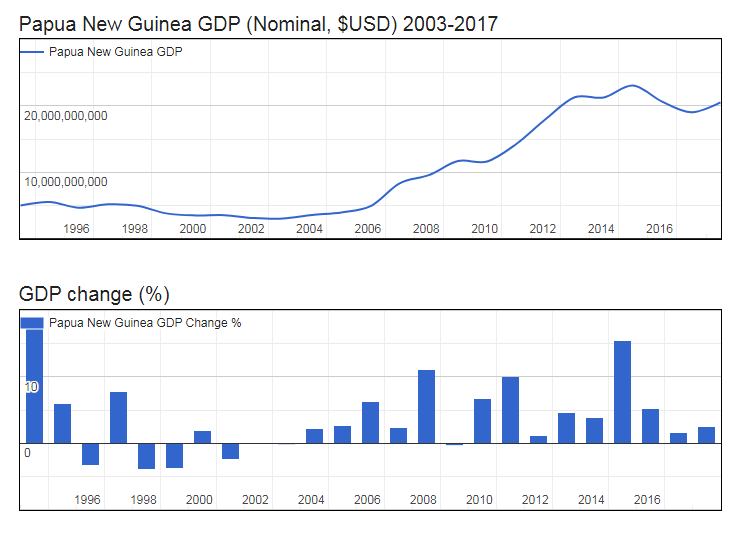
- Nominal (current) Gross Domestic Product GDP of Papua New Guinea is $20,536,314,601 (USD) as of 2017.
- Real GDP (constant, inflation adjusted) of Papua New Guinea reached $19,822,767,444 in 2017.
- GDP Growth Rate in 2017 was 2.55%, representing a change of 492,107,026 US$ over 2016, when Real GDP was $19,330,660,418.
- GDP per Capita in Papua New Guinea (with a population of 8,438,036 people) was $2,349 in 2017, an increase of $12 from $2,337 in 2016; this represents a change of 0.5% in GDP per capita.
Gross Domestic Product GDP of Papua New Guinea
| Year | GDP Nominal (Current USD) |
GDP Real (Inflation adj.) |
GDP change |
GDP per capita | Pop. change |
Population |
|---|---|---|---|---|---|---|
| 2017 | $20,536,314,601 | $19,822,767,444 | 2.55% | $2,349 | 2.01 % | 8,438,036 |
| 2016 | $19,028,120,013 | $19,330,660,418 | 1.59% | $2,337 | 2.02 % | 8,271,762 |
| 2015 | $20,638,636,035 | $19,027,666,647 | 5.30% | $2,347 | 2.03 % | 8,107,775 |
| 2014 | $23,060,047,128 | $18,070,132,678 | 15.42% | $2,274 | 2.03 % | 7,946,730 |
| 2013 | $21,261,305,413 | $15,655,783,399 | 3.83% | $2,010 | 2.06 % | 7,788,380 |
| 2012 | $21,295,834,133 | $15,078,295,061 | 4.65% | $1,976 | 2.13 % | 7,631,001 |
| 2011 | $17,984,816,533 | $14,408,526,151 | 1.11% | $1,928 | 2.21 % | 7,472,199 |
| 2010 | $14,250,726,290 | $14,250,726,290 | 10.12% | $1,949 | 2.32 % | 7,310,507 |
| 2009 | $11,619,541,940 | $12,940,537,475 | 6.81% | $1,811 | 2.42 % | 7,144,776 |
| 2008 | $11,670,678,864 | $12,115,978,031 | -0.29% | $1,737 | 2.46 % | 6,976,201 |
| 2007 | $9,545,071,325 | $12,151,737,734 | 11.10% | $1,785 | 2.43 % | 6,808,514 |
| 2006 | $8,306,343,442 | $10,937,876,243 | 2.29% | $1,646 | 2.34 % | 6,646,895 |
| 2005 | $4,865,892,972 | $10,692,539,548 | 6.34% | $1,646 | 2.21 % | 6,494,903 |
| 2004 | $3,927,157,867 | $10,054,595,954 | 2.72% | $1,582 | 2.10 % | 6,354,245 |
| 2003 | $3,536,411,824 | $9,788,240,722 | 2.16% | $1,573 | 2.05 % | 6,223,377 |
| 2002 | $2,999,511,040 | $9,580,900,221 | -0.16% | $1,571 | 2.08 % | 6,098,621 |
| 2001 | $3,081,024,212 | $9,596,148,552 | -0.12% | $1,606 | 2.17 % | 5,974,629 |
| 2000 | $3,521,339,699 | $9,607,801,720 | -2.49% | $1,643 | 2.30 % | 5,847,586 |
| 1999 | $3,477,038,204 | $9,853,634,327 | 1.86% | $1,724 | 2.41 % | 5,716,161 |
| 1998 | $3,789,443,015 | $9,674,125,702 | -3.77% | $1,733 | 2.48 % | 5,581,762 |
| 1997 | $4,936,615,299 | $10,053,036,011 | -3.90% | $1,846 | 2.49 % | 5,446,641 |
| 1996 | $5,155,311,077 | $10,461,493,480 | 7.73% | $1,969 | 2.45 % | 5,314,248 |
| 1995 | $4,636,057,476 | $9,710,512,020 | -3.31% | $1,872 | 2.40 % | 5,187,060 |
| 1994 | $5,502,786,070 | $10,043,187,460 | 5.94% | $1,983 | 2.36 % | 5,065,661 |