GDP of Saudi Arabia
| GDP nominal (2017) | GDP growth rate (2017) |
|---|---|
$686,738,400,000 |
-0.86% |
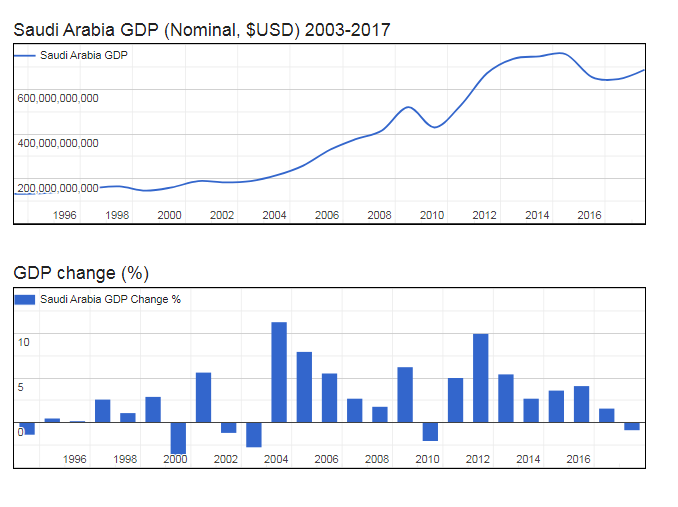
- Nominal (current) Gross Domestic Product (GDP of Saudi Arabia is $686,738,400,000 (USD) as of 2017.
- Real GDP (constant, inflation adjusted) of Saudi Arabia reached $684,157,600,000 in 2017.
- GDP Growth Rate in 2017 was -0.86%, representing a change of -5,911,200,000 US$ over 2016, when Real GDP was $690,068,800,000.
- GDP per Capita in Saudi Arabia (with a population of 33,101,179 people) was $20,669 in 2017, a decrease of $601 from $21,270 in 2016; this represents a change of -2.8% in GDP per capita.
Gross Domestic Product (GDP of Saudi Arabia
| Year | GDP Nominal (Current USD) |
GDP Real (Inflation adj.) |
GDP change |
GDP per capita | Pop. change |
Population |
|---|---|---|---|---|---|---|
| 2017 | $686,738,400,000 | $684,157,600,000 | -0.86% | $20,669 | 2.03 % | 33,101,179 |
| 2016 | $644,935,541,440 | $690,068,800,000 | 1.67% | $21,270 | 2.29 % | 32,443,447 |
| 2015 | $654,269,902,880 | $678,729,654,960 | 4.11% | $21,399 | 2.59 % | 31,717,667 |
| 2014 | $756,350,347,333 | $651,957,609,840 | 3.65% | $21,088 | 2.88 % | 30,916,597 |
| 2013 | $746,647,127,413 | $628,984,081,387 | 2.70% | $20,930 | 3.08 % | 30,052,059 |
| 2012 | $735,974,843,360 | $612,452,430,240 | 5.41% | $21,007 | 3.14 % | 29,154,900 |
| 2011 | $671,238,840,107 | $581,011,322,640 | 10.00% | $20,554 | 3.09 % | 28,267,589 |
| 2010 | $528,207,200,000 | $528,207,200,000 | 5.04% | $19,263 | 2.97 % | 27,421,461 |
| 2009 | $429,097,866,667 | $502,865,333,333 | -2.06% | $18,883 | 2.87 % | 26,630,303 |
| 2008 | $519,796,800,000 | $513,438,407,147 | 6.25% | $19,833 | 2.80 % | 25,888,541 |
| 2007 | $415,964,509,673 | $483,237,181,440 | 1.85% | $19,188 | 2.80 % | 25,184,597 |
| 2006 | $376,900,133,511 | $474,473,046,267 | 2.79% | $19,368 | 2.86 % | 24,498,310 |
| 2005 | $328,459,608,764 | $461,601,733,253 | 5.57% | $19,382 | 2.95 % | 23,816,183 |
| 2004 | $258,742,133,333 | $437,231,125,627 | 7.96% | $18,901 | 3.01 % | 23,132,682 |
| 2003 | $215,807,655,253 | $404,999,478,400 | 11.24% | $18,035 | 2.99 % | 22,456,649 |
| 2002 | $189,605,920,240 | $364,070,454,427 | -2.82% | $16,696 | 2.84 % | 21,805,313 |
| 2001 | $184,137,469,733 | $374,631,983,413 | -1.21% | $17,669 | 2.61 % | 21,202,642 |
| 2000 | $189,514,926,213 | $379,223,407,547 | 5.63% | $18,352 | 2.32 % | 20,663,843 |
| 1999 | $161,716,960,000 | $359,026,663,653 | -3.76% | $17,778 | 2.08 % | 20,194,527 |
| 1998 | $146,775,498,080 | $373,066,209,147 | 2.89% | $18,858 | 1.94 % | 19,783,304 |
| 1997 | $165,963,557,410 | $362,575,583,120 | 1.10% | $18,683 | 1.96 % | 19,407,142 |
| 1996 | $158,662,398,745 | $358,617,230,507 | 2.64% | $18,841 | 2.12 % | 19,033,845 |
| 1995 | $143,343,036,342 | $349,402,017,093 | 0.21% | $18,746 | 2.33 % | 18,638,787 |
| 1994 | $135,174,886,489 | $348,662,534,027 | 0.56% | $19,142 | 2.54 % | 18,214,470 |