GDP of Switzerland
| GDP nominal (2017) | GDP growth rate (2017) |
|---|---|
$678,965,423,322 |
1.09% |
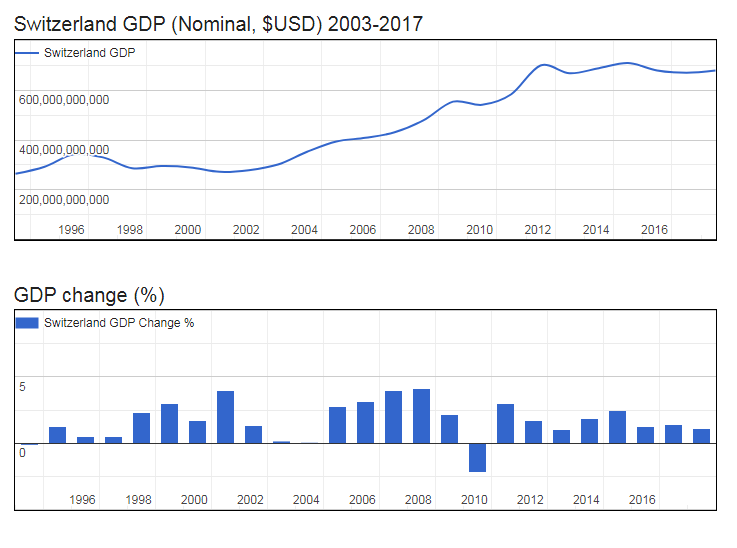
- Nominal (current) Gross Domestic Product (GDP of Switzerland is $678,965,423,322 (USD) as of 2017.
- Real GDP (constant, inflation adjusted) of Switzerland reached $654,611,752,744 in 2017.
- GDP Growth Rate in 2017 was 1.09%, representing a change of 10,414,683,480 US$ over 2016, when Real GDP was $644,197,069,264.
- GDP per Capita in Switzerland (with a population of 8,455,804 people) was $77,416 in 2017, an increase of $542 from $76,874 in 2016; this represents a change of 0.7% in GDP per capita.
Gross Domestic Product (GDP of Switzerland
| Year | GDP Nominal (Current USD) |
GDP Real (Inflation adj.) |
GDP change |
GDP per capita | Pop. change |
Population |
|---|---|---|---|---|---|---|
| 2017 | $678,965,423,322 | $654,611,752,744 | 1.09% | $77,416 | 0.91 % | 8,455,804 |
| 2016 | $670,181,065,629 | $644,197,069,264 | 1.38% | $76,874 | 1.00 % | 8,379,917 |
| 2015 | $679,832,291,693 | $634,044,597,807 | 1.23% | $76,421 | 1.11 % | 8,296,775 |
| 2014 | $709,182,559,935 | $625,701,684,970 | 2.45% | $76,249 | 1.20 % | 8,206,002 |
| 2013 | $688,504,173,431 | $610,743,250,749 | 1.85% | $75,318 | 1.26 % | 8,108,878 |
| 2012 | $668,043,614,123 | $599,637,721,742 | 1.01% | $74,880 | 1.28 % | 8,008,012 |
| 2011 | $699,579,638,638 | $593,665,305,709 | 1.69% | $75,081 | 1.26 % | 7,906,992 |
| 2010 | $583,782,977,866 | $583,782,977,866 | 3.00% | $74,761 | 1.23 % | 7,808,675 |
| 2009 | $541,506,500,414 | $566,764,738,131 | -2.22% | $73,473 | 1.19 % | 7,713,898 |
| 2008 | $554,363,487,120 | $579,645,072,565 | 2.15% | $76,041 | 1.14 % | 7,622,821 |
| 2007 | $479,913,034,322 | $567,418,887,242 | 4.11% | $75,285 | 1.06 % | 7,536,982 |
| 2006 | $430,921,192,375 | $545,008,791,663 | 3.99% | $73,077 | 0.96 % | 7,457,958 |
| 2005 | $408,689,353,999 | $524,104,192,490 | 3.12% | $70,951 | 0.86 % | 7,386,816 |
| 2004 | $394,163,688,621 | $508,270,323,944 | 2.78% | $69,400 | 0.76 % | 7,323,737 |
| 2003 | $352,914,820,747 | $494,540,766,952 | 0.04% | $68,040 | 0.66 % | 7,268,359 |
| 2002 | $301,416,810,214 | $494,345,122,120 | 0.16% | $68,465 | 0.57 % | 7,220,377 |
| 2001 | $278,631,271,391 | $493,542,558,242 | 1.31% | $68,746 | 0.50 % | 7,179,169 |
| 2000 | $272,055,499,941 | $487,149,098,174 | 3.94% | $68,192 | 0.40 % | 7,143,761 |
| 1999 | $289,912,492,345 | $468,697,312,456 | 1.69% | $65,874 | 0.33 % | 7,115,027 |
| 1998 | $295,045,152,021 | $460,886,576,237 | 2.99% | $64,989 | 0.33 % | 7,091,770 |
| 1997 | $286,519,135,327 | $447,506,612,520 | 2.34% | $63,310 | 0.43 % | 7,068,508 |
| 1996 | $330,091,688,350 | $437,273,751,337 | 0.54% | $62,130 | 0.61 % | 7,038,033 |
| 1995 | $342,617,007,104 | $434,925,036,081 | 0.48% | $62,172 | 0.82 % | 6,995,521 |
| 1994 | $292,646,657,673 | $432,843,636,284 | 1.27% | $62,384 | 1.01 % | 6,938,415 |