GDP of Seychelles
| GDP nominal (2017) | GDP growth rate (2017) |
|---|---|
$1,497,959,569 |
5.28% |
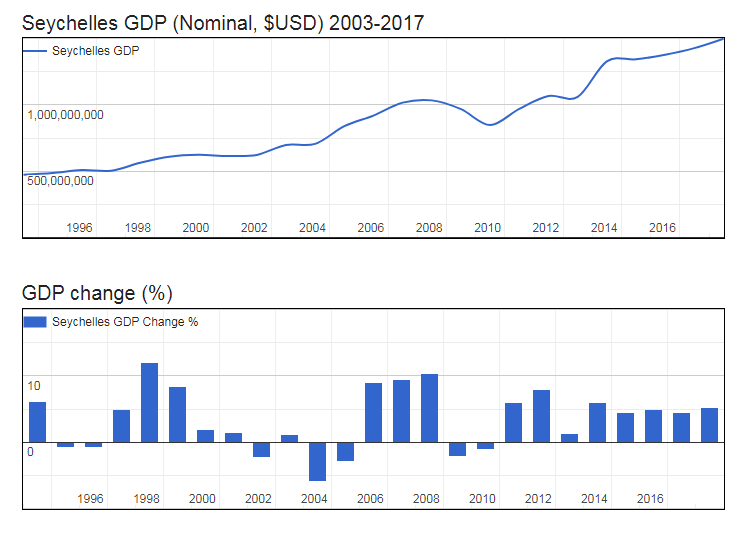
- Nominal (current) Gross Domestic Product (GDP of Seychelles is $1,497,959,569 (USD) as of 2017.
- Real GDP (constant, inflation adjusted) of Seychelles reached $1,355,489,119 in 2017.
- GDP Growth Rate in 2017 was 5.28%, representing a change of 68,039,436 US$ over 2016, when Real GDP was $1,287,449,683.
- GDP per Capita in Seychelles (with a population of 96,418 people) was $14,058 in 2017, an increase of $607 from $13,452 in 2016; this represents a change of 4.5% in GDP per capita. GDP of Seychelles
Gross Domestic Product (GDP of Seychelles
| Year | GDP Nominal (Current USD) |
GDP Real (Inflation adj.) |
GDP change |
GDP per capita | Pop. change |
Population |
|---|---|---|---|---|---|---|
| 2017 | $1,497,959,569 | $1,355,489,119 | 5.28% | $14,058 | 0.74 % | 96,418 |
| 2016 | $1,427,525,457 | $1,287,449,683 | 4.50% | $13,452 | 0.77 % | 95,710 |
| 2015 | $1,377,492,466 | $1,231,973,526 | 4.94% | $12,971 | 0.81 % | 94,978 |
| 2014 | $1,343,010,475 | $1,174,008,204 | 4.50% | $12,461 | 0.88 % | 94,215 |
| 2013 | $1,328,158,360 | $1,123,401,382 | 6.02% | $12,028 | 0.86 % | 93,395 |
| 2012 | $1,060,222,480 | $1,059,631,924 | 1.26% | $11,443 | 0.78 % | 92,603 |
| 2011 | $1,065,826,670 | $1,046,438,131 | 7.89% | $11,389 | 0.68 % | 91,883 |
| 2010 | $969,936,525 | $969,936,525 | 5.95% | $10,628 | 0.51 % | 91,264 |
| 2009 | $847,397,850 | $915,423,405 | -1.11% | $10,082 | 0.39 % | 90,802 |
| 2008 | $967,199,594 | $925,654,159 | -2.15% | $10,234 | 0.40 % | 90,449 |
| 2007 | $1,033,561,654 | $945,962,968 | 10.42% | $10,500 | 0.63 % | 90,088 |
| 2006 | $1,016,418,229 | $856,684,174 | 9.41% | $9,569 | 0.99 % | 89,526 |
| 2005 | $919,103,255 | $783,031,253 | 9.01% | $8,833 | 1.44 % | 88,648 |
| 2004 | $839,319,927 | $718,339,327 | -2.85% | $8,220 | 1.84 % | 87,393 |
| 2003 | $705,704,816 | $739,416,039 | -5.89% | $8,617 | 2.06 % | 85,810 |
| 2002 | $697,518,248 | $785,669,398 | 1.21% | $9,345 | 2.02 % | 84,077 |
| 2001 | $622,262,057 | $776,254,738 | -2.27% | $9,419 | 1.75 % | 82,414 |
| 2000 | $614,879,765 | $794,294,458 | 1.51% | $9,807 | 1.38 % | 80,996 |
| 1999 | $622,985,494 | $782,445,581 | 1.87% | $9,793 | 1.05 % | 79,897 |
| 1998 | $608,369,282 | $768,067,310 | 8.40% | $9,715 | 0.90 % | 79,064 |
| 1997 | $562,958,837 | $708,526,966 | 11.96% | $9,043 | 0.98 % | 78,355 |
| 1996 | $503,068,472 | $632,830,581 | 4.92% | $8,156 | 1.23 % | 77,594 |
| 1995 | $508,221,508 | $603,169,565 | -0.83% | $7,869 | 1.60 % | 76,649 |
| 1994 | $486,451,205 | $608,191,048 | -0.80% | $8,062 | 1.86 % | 75,440 |