GDP of South Africa
| GDP nominal (2017) | GDP growth rate (2017) |
|---|---|
$348,871,647,960 |
1.32% |
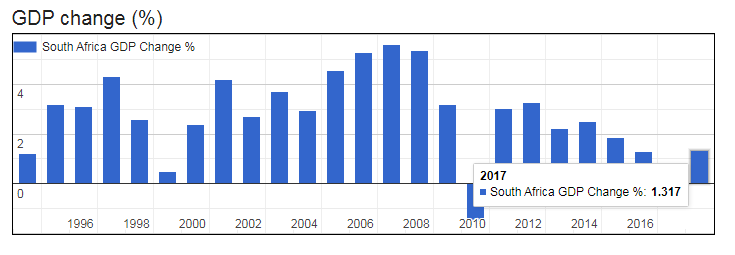
- Nominal (current) Gross Domestic Product (GDP of South Africa is $348,871,647,960 (USD) as of 2017.
- Real GDP (constant, inflation adjusted) of South Africa reached $426,813,227,524 in 2017.
- GDP Growth Rate in 2017 was 1.32%, representing a change of 5,547,001,381 US$ over 2016, when Real GDP was $421,266,226,143.
- GDP per Capita in South Africa (with a population of 57,009,756 people) was $7,487 in 2017, a decrease of $8 from $7,495 in 2016; this represents a change of -0.1% in GDP per capita.

Gross Domestic Product (GDP of South Africa
| Year | GDP Nominal (Current USD) |
GDP Real (Inflation adj.) |
GDP change |
GDP per capita | Pop. change |
Population |
|---|---|---|---|---|---|---|
| 2017 | $348,871,647,960 | $426,813,227,524 | 1.32% | $7,487 | 1.43 % | 57,009,756 |
| 2016 | $295,746,599,722 | $421,266,226,143 | 0.57% | $7,495 | 1.48 % | 56,207,646 |
| 2015 | $317,536,830,641 | $418,898,007,438 | 1.28% | $7,563 | 1.54 % | 55,386,367 |
| 2014 | $350,636,208,164 | $413,605,718,439 | 1.85% | $7,583 | 1.60 % | 54,544,186 |
| 2013 | $366,643,223,164 | $406,104,993,311 | 2.49% | $7,564 | 1.62 % | 53,687,121 |
| 2012 | $396,327,875,201 | $396,257,207,214 | 2.21% | $7,500 | 1.59 % | 52,832,658 |
| 2011 | $416,418,874,939 | $387,676,549,661 | 3.28% | $7,455 | 1.54 % | 52,003,755 |
| 2010 | $375,349,442,837 | $375,349,442,837 | 3.04% | $7,329 | 1.47 % | 51,216,964 |
| 2009 | $295,936,485,833 | $364,276,420,244 | -1.54% | $7,217 | 1.40 % | 50,477,011 |
| 2008 | $286,769,839,733 | $369,966,840,761 | 3.19% | $7,432 | 1.34 % | 49,779,471 |
| 2007 | $299,415,505,152 | $358,526,105,166 | 5.36% | $7,299 | 1.30 % | 49,119,759 |
| 2006 | $271,638,484,826 | $340,285,199,108 | 5.60% | $7,018 | 1.27 % | 48,489,459 |
| 2005 | $257,671,413,751 | $322,228,183,700 | 5.28% | $6,730 | 1.25 % | 47,880,601 |
| 2004 | $228,937,347,866 | $306,076,361,734 | 4.55% | $6,472 | 1.23 % | 47,291,610 |
| 2003 | $175,256,916,996 | $292,743,217,487 | 2.95% | $6,266 | 1.23 % | 46,719,196 |
| 2002 | $115,748,110,113 | $284,357,295,801 | 3.70% | $6,161 | 1.27 % | 46,150,913 |
| 2001 | $121,600,818,310 | $274,210,460,320 | 2.70% | $6,017 | 1.34 % | 45,571,274 |
| 2000 | $136,361,854,808 | $267,001,436,053 | 4.20% | $5,938 | 1.42 % | 44,967,708 |
| 1999 | $136,631,966,609 | $256,239,373,462 | 2.40% | $5,779 | 1.50 % | 44,338,543 |
| 1998 | $137,774,361,015 | $250,233,772,323 | 0.50% | $5,728 | 1.62 % | 43,682,260 |
| 1997 | $152,586,154,514 | $248,988,825,940 | 2.60% | $5,792 | 1.77 % | 42,987,461 |
| 1996 | $147,607,982,695 | $242,679,162,577 | 4.30% | $5,745 | 1.94 % | 42,241,011 |
| 1995 | $155,460,285,076 | $232,674,175,450 | 3.10% | $5,615 | 2.15 % | 41,435,758 |
| 1994 | $139,752,450,152 | $225,678,162,745 | 3.20% | $5,564 | 2.35 % | 40,564,059 |