GDP of Thailand
| GDP nominal (2017) | GDP growth rate (2017) |
|---|---|
$455,302,682,986 |
3.91% |
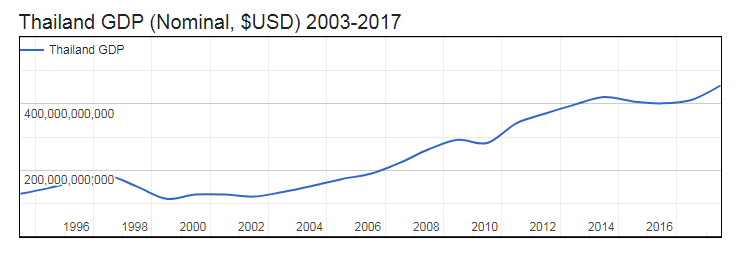
- Nominal (current) Gross Domestic Product (GDP of Thailand is $455,302,682,986 (USD) as of 2017.
- Real GDP (constant, inflation adjusted) of Thailand reached $422,940,667,450 in 2017.
- GDP Growth Rate in 2017 was 3.91%, representing a change of 15,925,996,640 US$ over 2016, when Real GDP was $407,014,670,810.
- GDP per Capita in Thailand (with a population of 69,209,810 people) was $6,111 in 2017, an increase of $210 from $5,901 in 2016; this represents a change of 3.6% in GDP per capita.

Gross Domestic Product (GDP of Thailand
| Year | GDP Nominal (Current USD) |
GDP Real (Inflation adj.) |
GDP change |
GDP per capita | Pop. change |
Population |
|---|---|---|---|---|---|---|
| 2017 | $455,302,682,986 | $422,940,667,450 | 3.91% | $6,111 | 0.35 % | 69,209,810 |
| 2016 | $411,755,164,833 | $407,014,670,810 | 3.28% | $5,901 | 0.37 % | 68,971,308 |
| 2015 | $401,399,422,443 | $394,078,328,227 | 3.02% | $5,735 | 0.40 % | 68,714,511 |
| 2014 | $407,339,361,696 | $382,525,395,709 | 0.98% | $5,589 | 0.43 % | 68,438,746 |
| 2013 | $420,333,333,333 | $378,796,469,985 | 2.69% | $5,559 | 0.45 % | 68,144,518 |
| 2012 | $397,558,094,270 | $368,883,177,547 | 7.24% | $5,438 | 0.47 % | 67,835,962 |
| 2011 | $370,818,747,397 | $343,970,153,354 | 0.84% | $5,094 | 0.48 % | 67,518,388 |
| 2010 | $341,105,009,515 | $341,105,009,515 | 7.51% | $5,076 | 0.49 % | 67,195,028 |
| 2009 | $281,710,095,725 | $317,266,875,218 | -0.69% | $4,745 | 0.50 % | 66,866,839 |
| 2008 | $291,383,081,232 | $319,473,585,807 | 1.73% | $4,802 | 0.53 % | 66,530,984 |
| 2007 | $262,942,650,544 | $314,054,055,752 | 5.44% | $4,745 | 0.56 % | 66,182,067 |
| 2006 | $221,758,486,880 | $297,864,826,689 | 4.97% | $4,526 | 0.61 % | 65,812,536 |
| 2005 | $189,318,499,954 | $283,767,493,632 | 4.19% | $4,338 | 0.65 % | 65,416,189 |
| 2004 | $172,895,476,153 | $272,361,445,882 | 6.29% | $4,190 | 0.69 % | 64,995,299 |
| 2003 | $152,280,653,544 | $256,245,431,314 | 7.19% | $3,970 | 0.75 % | 64,549,866 |
| 2002 | $134,300,851,255 | $239,058,711,719 | 6.15% | $3,731 | 0.83 % | 64,069,087 |
| 2001 | $120,296,746,257 | $225,210,772,012 | 3.44% | $3,544 | 0.93 % | 63,539,196 |
| 2000 | $126,392,308,498 | $217,712,232,033 | 4.46% | $3,458 | 1.05 % | 62,952,642 |
| 1999 | $126,668,932,160 | $208,425,468,396 | 4.57% | $3,346 | 1.16 % | 62,298,571 |
| 1998 | $113,675,706,127 | $199,312,314,683 | -7.63% | $3,236 | 1.21 % | 61,585,103 |
| 1997 | $150,180,268,649 | $215,784,747,526 | -2.75% | $3,546 | 1.19 % | 60,846,582 |
| 1996 | $183,035,154,107 | $221,894,822,451 | 5.65% | $3,690 | 1.11 % | 60,130,186 |
| 1995 | $169,278,552,851 | $210,023,508,390 | 8.12% | $3,532 | 1.01 % | 59,467,274 |
| 1994 | $146,683,499,006 | $194,249,907,287 | 8.00% | $3,299 | 0.92 % | 58,875,269 |