GDP of Iran
| GDP nominal (2017) | GDP growth rate (2017) |
|---|---|
$454,012,768,724 |
3.76% |
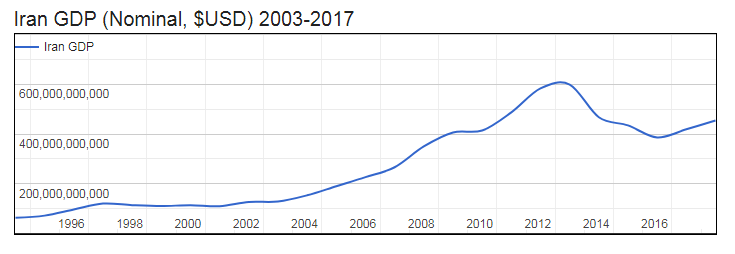
- Nominal (current) Gross Domestic Product (GDP of Iran is $454,012,768,724 (USD) as of 2017.
- Real GDP (constant, inflation adjusted) of the Islamic Republic of Iran reached $560,881,092,998 in 2017.
- GDP Growth Rate in 2017 was 3.76%, representing a change of 20,299,838,960 US$ over 2016, when Real GDP was $540,581,254,038.
- GDP per Capita in the Islamic Republic of Iran (with a population of 80,673,883 people) was $6,952 in 2017, an increase of $158 from $6,794 in 2016; this represents a change of 2.3% in GDP per capita.

Gross Domestic Product (GDP of Iran
| Year | GDP Nominal (Current USD) |
GDP Real (Inflation adj.) |
GDP change |
GDP per capita | Pop. change |
Population |
|---|---|---|---|---|---|---|
| 2017 | $454,012,768,724 | $560,881,092,998 | 3.76% | $6,952 | 1.39 % | 80,673,883 |
| 2016 | $418,976,679,729 | $540,581,254,038 | 13.40% | $6,794 | 1.37 % | 79,563,989 |
| 2015 | $385,874,474,399 | $476,718,833,682 | -1.32% | $6,073 | 1.33 % | 78,492,215 |
| 2014 | $434,474,616,832 | $483,098,855,136 | 4.60% | $6,236 | 1.29 % | 77,465,770 |
| 2013 | $467,414,852,231 | $461,838,494,677 | -0.19% | $6,039 | 1.25 % | 76,481,961 |
| 2012 | $598,853,401,276 | $462,736,543,549 | -7.44% | $6,126 | 1.21 % | 75,539,878 |
| 2011 | $583,500,357,530 | $499,956,057,363 | 2.65% | $6,699 | 1.18 % | 74,634,957 |
| 2010 | $487,069,570,464 | $487,069,570,464 | 5.80% | $6,603 | 1.15 % | 73,762,519 |
| 2009 | $414,059,094,949 | $460,377,185,305 | 1.01% | $6,313 | 1.12 % | 72,924,837 |
| 2008 | $406,070,949,554 | $455,785,666,778 | 0.25% | $6,320 | 1.10 % | 72,120,604 |
| 2007 | $349,881,601,459 | $454,645,159,600 | 8.16% | $6,373 | 1.11 % | 71,336,475 |
| 2006 | $266,298,911,661 | $420,361,433,134 | 5.00% | $5,958 | 1.14 % | 70,554,760 |
| 2005 | $226,452,138,292 | $400,345,002,660 | 3.19% | $5,739 | 1.18 % | 69,762,347 |
| 2004 | $190,043,433,965 | $387,969,534,588 | 4.37% | $5,627 | 1.22 % | 68,951,281 |
| 2003 | $153,544,751,395 | $371,709,086,133 | 8.73% | $5,456 | 1.25 % | 68,122,938 |
| 2002 | $128,626,917,504 | $341,849,916,533 | 7.27% | $5,081 | 1.26 % | 67,284,796 |
| 2001 | $126,878,750,296 | $318,694,970,501 | 0.78% | $4,796 | 1.26 % | 66,449,112 |
| 2000 | $109,591,707,802 | $316,232,660,520 | 5.86% | $4,819 | 1.27 % | 65,623,405 |
| 1999 | $113,848,450,088 | $298,732,699,998 | 0.86% | $4,610 | 1.30 % | 64,800,880 |
| 1998 | $110,276,913,363 | $296,198,841,514 | 2.18% | $4,630 | 1.32 % | 63,971,836 |
| 1997 | $113,919,163,421 | $289,885,644,880 | 0.48% | $4,591 | 1.35 % | 63,136,312 |
| 1996 | $120,403,931,885 | $288,494,963,935 | 5.17% | $4,631 | 1.39 % | 62,294,920 |
| 1995 | $96,419,225,744 | $274,304,418,739 | 2.28% | $4,464 | 1.41 % | 61,442,664 |
| 1994 | $71,841,461,173 | $268,182,716,269 | -1.51% | $4,426 | 1.45 % | 60,590,614 |