Aruba Population 2023
- The current population of Aruba is 107,828 as of Monday, November 7, 2022, based on elaboration of the latest United Nations data.
- Aruba ranks number 197 in the list of countries (and dependencies) by population.
- The population density in Aruba is 593 per Km2 (1,536 people per mi2).
- Aruba 2020 population is estimated at 106,766 people at mid year according to UN data.
- 43.6 % of the population is urban (46,511 people in 2020)
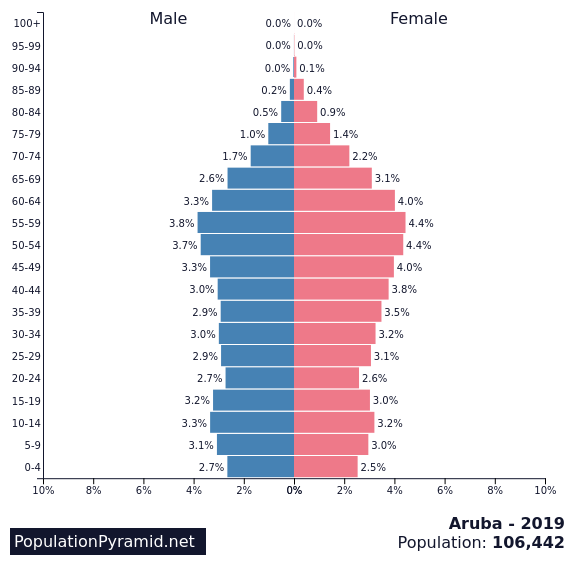
- The median age in Aruba is 41.0 years.
- Aruba population is equivalent to 0% of the total world population.
- The total land area is 180 Km2 (69 sq. miles)
Aruba Population in 2020 and its Historicals
| Year | Population | Yearly % Change |
Yearly Change |
Migrants (net) | Median Age | Fertility Rate | Density (P/Km²) | Urban Pop % |
Urban Population | Country’s Share of World Pop |
World Population | Aruba Global Rank |
|---|---|---|---|---|---|---|---|---|---|---|---|---|
| 2020 | 106,766 | 0.43 % | 452 | 201 | 41.0 | 1.90 | 593 | 43.6 % | 46,511 | 0.00 % | 7,794,798,739 | 197 |
| 2019 | 106,314 | 0.44 % | 469 | 201 | 40.3 | 1.82 | 591 | 43.4 % | 46,182 | 0.00 % | 7,713,468,100 | 197 |
| 2018 | 105,845 | 0.45 % | 479 | 201 | 40.3 | 1.82 | 588 | 43.3 % | 45,872 | 0.00 % | 7,631,091,040 | 197 |
| 2017 | 105,366 | 0.47 % | 494 | 201 | 40.3 | 1.82 | 585 | 43.3 % | 45,572 | 0.00 % | 7,547,858,925 | 197 |
| 2016 | 104,872 | 0.51 % | 531 | 201 | 40.3 | 1.82 | 583 | 43.2 % | 45,275 | 0.00 % | 7,464,022,049 | 197 |
| 2015 | 104,341 | 0.52 % | 534 | 251 | 40.1 | 1.80 | 580 | 43.1 % | 44,979 | 0.00 % | 7,379,797,139 | 198 |
| 2010 | 101,669 | 0.33 % | 328 | -88 | 38.4 | 1.76 | 565 | 43.1 % | 43,778 | 0.00 % | 6,956,823,603 | 199 |
| 2005 | 100,031 | 1.94 % | 1,836 | 1,253 | 36.2 | 1.82 | 556 | 44.9 % | 44,889 | 0.00 % | 6,541,907,027 | 198 |
| 2000 | 90,853 | 2.49 % | 2,106 | 1,385 | 34.4 | 1.95 | 505 | 46.7 % | 42,444 | 0.00 % | 6,143,493,823 | 198 |
| 1995 | 80,324 | 5.26 % | 3,635 | 2,844 | 32.5 | 2.17 | 446 | 48.8 % | 39,171 | 0.00 % | 5,744,212,979 | 198 |
| 1990 | 62,149 | -0.28 % | -175 | -1,039 | 31.2 | 2.30 | 345 | 50.3 % | 31,273 | 0.00 % | 5,327,231,061 | 203 |
| 1985 | 63,026 | 0.96 % | 586 | -384 | 28.0 | 2.36 | 350 | 50.4 % | 31,762 | 0.00 % | 4,870,921,740 | 202 |
| 1980 | 60,096 | -0.19 % | -112 | -1,094 | 26.0 | 2.45 | 334 | 50.5 % | 30,331 | 0.00 % | 4,458,003,514 | 201 |
| 1975 | 60,657 | 0.53 % | 319 | -707 | 23.9 | 2.65 | 337 | 50.5 % | 30,661 | 0.00 % | 4,079,480,606 | 198 |
| 1970 | 59,063 | 0.59 % | 341 | -855 | 20.8 | 3.30 | 328 | 50.6 % | 29,900 | 0.00 % | 3,700,437,046 | 198 |
| 1965 | 57,360 | 1.14 % | 630 | -865 | 19.1 | 4.40 | 319 | 50.7 % | 29,082 | 0.00 % | 3,339,583,597 | 196 |
| 1960 | 54,211 | 4.39 % | 2,097 | 557 | 18.1 | 5.15 | 301 | 50.8 % | 27,526 | 0.00 % | 3,034,949,748 | 193 |
| 1955 | 43,724 | 2.81 % | 1,131 | -316 | 18.1 | 5.65 | 243 | 50.9 % | 22,235 | 0.00 % | 2,773,019,936 | 196 |
Source: Estimation of Aruba’s population is from United Nations, Department of Economic and Social Affairs, Population Division. ( World Population Prospects: The 2019 Revision).
Aruba Population Future Forecast
| Year | Population | Yearly % Change |
Yearly Change |
Migrants (net) | Median Age | Fertility Rate | Density (P/Km²) | Urban Pop % |
Urban Population | Country’s Share of World Pop |
World Population | Aruba Global Rank |
|---|---|---|---|---|---|---|---|---|---|---|---|---|
| 2020 | 106,766 | 0.46 % | 485 | 201 | 41.0 | 1.90 | 593 | 43.6 % | 46,511 | 0.00 % | 7,794,798,739 | 197 |
| 2025 | 108,752 | 0.37 % | 397 | 161 | 41.2 | 1.90 | 604 | 44.4 % | 48,340 | 0.00 % | 8,184,437,460 | 198 |
| 2030 | 110,247 | 0.27 % | 299 | 129 | 40.7 | 1.90 | 612 | 45.8 % | 50,480 | 0.00 % | 8,548,487,400 | 198 |
| 2035 | 111,057 | 0.15 % | 162 | 104 | 41.3 | 1.90 | 617 | 47.5 % | 52,768 | 0.00 % | 8,887,524,213 | 198 |
| 2040 | 110,928 | -0.02 % | -26 | 83 | 42.0 | 1.90 | 616 | 49.5 % | 54,952 | 0.00 % | 9,198,847,240 | 198 |
| 2045 | 109,993 | -0.17 % | -187 | 67 | 42.7 | 1.90 | 611 | 51.6 % | 56,710 | 0.00 % | 9,481,803,274 | 198 |
| 2050 | 108,716 | -0.23 % | -255 | 43.3 | 1.90 | 604 | 53.5 % | 58,214 | 0.00 % | 9,735,033,990 | 199 |
Aruba Population Stats
LIFE EXPECTANCY
INFANT MORTALITY
DEATHS UNDER AGE 5
LIFE EXPECTANCY
76.79 years
(life expectancy at birth, both sexes)
INFANT MORTALITY
12.5
(infant deaths per 1,000 live births)
DEATHS UNDER AGE 5
14.5
(per 1,000 live births)
Main Cities by Population in Aruba
(includes boroughs, districts, urban agglomerations, etc.)
| # | CITY NAME | POPULATION |
|---|---|---|
| 1 | Oranjestad | 29,998 |
| 2 | Tanki Leendert | 21,500 |
| 3 | San Nicolas | 15,200 |
Notes
The Aruba Population (Live) counter shows a continuously updated estimate of the current population of Aruba delivered by DataCountries algorithm, which processes data collected from the United Nations Population Division.
The Population of Aruba (1950 – 2019) chart plots the total population count as of July 1 of each year, from 1950 to 2019.
The Yearly Population Growth Rate chart plots the annual percentage changes in population registered on July 1 of each year, from 1951 to 2019. This value can differ from the Yearly % Change shown in the historical table, which shows the last year equivalent percentage change assuming homogeneous change in the preceding five year period.
See also
- Population of Algeria
- GDP (Gross Domestic Product) of Algeria
- Demographics of Africa
- World Demographics
- Demographics
- Population
Related Topics:
Sources:
- GeoNames
- World Population Prospects: The 2019 Revision – United Nations Population Division
- Organisation for Economic Co-operation and Development (OECD)
- World Urbanization Prospects – Population Division – United Nations
- United Nations Statistics Division
- World Bank