GDP of Bahrain
| GDP nominal (2017) | GDP growth rate (2017) |
|---|---|
$35,432,686,170 |
3.88% |
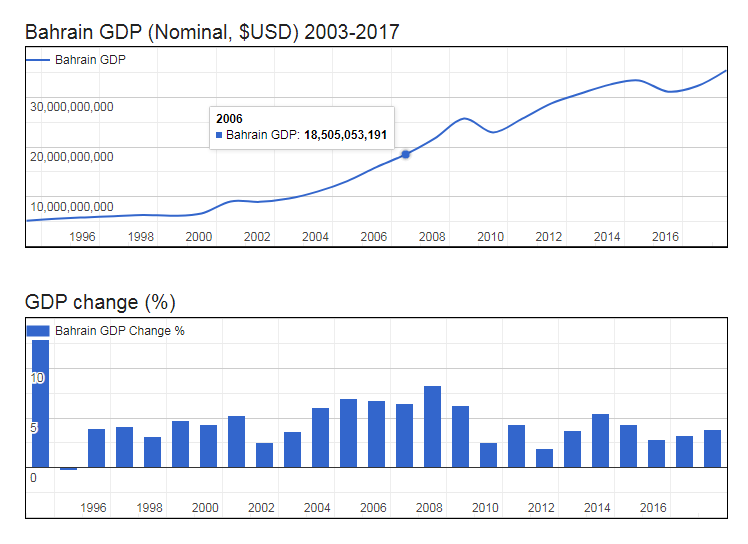
- Nominal (current) Gross Domestic Product (GDP of Bahrain is $35,432,686,170 (USD) as of 2017.
- Real GDP (constant, inflation adjusted) of Bahrain reached $33,058,875,381 in 2017.
- GDP Growth Rate in 2017 was 3.88%, representing a change of 1,211,328,534 US$ over 2016, when Real GDP was $31,847,546,847.
- GDP per Capita in Bahrain (with a population of 1,494,076 people) was $22,127 in 2017, a decrease of $210 from $22,337 in 2016; this represents a change of -0.9% in GDP per capita.
Gross Domestic Product (GDP of Bahrain
| Year | GDP Nominal (Current USD) |
GDP Real (Inflation adj.) |
GDP change |
GDP per capita | Pop. change |
Population |
|---|---|---|---|---|---|---|
| 2017 | $35,432,686,170 | $33,058,875,381 | 3.88% | $22,127 | 4.79 % | 1,494,076 |
| 2016 | $32,250,132,979 | $31,847,546,847 | 3.22% | $22,337 | 3.93 % | 1,425,792 |
| 2015 | $31,125,851,064 | $30,779,223,484 | 2.86% | $22,436 | 2.68 % | 1,371,851 |
| 2014 | $33,387,712,766 | $29,922,841,391 | 4.35% | $22,396 | 1.60 % | 1,336,075 |
| 2013 | $32,539,547,872 | $28,675,502,255 | 5.42% | $21,806 | 1.16 % | 1,315,028 |
| 2012 | $30,749,308,511 | $27,202,099,524 | 3.73% | $20,926 | 1.71 % | 1,299,944 |
| 2011 | $28,776,595,745 | $26,223,377,132 | 1.98% | $20,517 | 3.01 % | 1,278,151 |
| 2010 | $25,713,271,277 | $25,713,271,277 | 4.33% | $20,722 | 4.71 % | 1,240,860 |
| 2009 | $22,938,218,085 | $24,645,054,296 | 2.54% | $20,796 | 6.32 % | 1,185,076 |
| 2008 | $25,710,877,660 | $24,034,629,396 | 6.25% | $21,563 | 7.60 % | 1,114,641 |
| 2007 | $21,730,000,000 | $22,621,864,900 | 8.29% | $21,837 | 8.09 % | 1,035,919 |
| 2006 | $18,505,053,191 | $20,889,606,053 | 6.47% | $21,796 | 7.79 % | 958,418 |
| 2005 | $15,968,726,862 | $19,620,444,334 | 6.77% | $22,066 | 7.15 % | 889,164 |
| 2004 | $13,150,166,755 | $18,376,546,950 | 6.98% | $22,145 | 6.57 % | 829,844 |
| 2003 | $11,074,822,074 | $17,177,401,648 | 6.02% | $22,059 | 5.93 % | 778,708 |
| 2002 | $9,632,155,053 | $16,201,435,104 | 3.61% | $22,038 | 5.39 % | 735,146 |
| 2001 | $8,976,207,713 | $15,636,315,476 | 2.49% | $22,416 | 4.96 % | 697,545 |
| 2000 | $9,062,906,915 | $15,256,276,507 | 5.30% | $22,955 | 4.41 % | 664,611 |
| 1999 | $6,621,010,372 | $14,488,392,461 | 4.30% | $22,761 | 3.72 % | 636,541 |
| 1998 | $6,183,776,596 | $13,891,076,324 | 4.79% | $22,635 | 3.15 % | 613,700 |
| 1997 | $6,349,202,394 | $13,256,108,363 | 3.09% | $22,282 | 2.81 % | 594,931 |
| 1996 | $6,101,861,436 | $12,858,398,136 | 4.11% | $22,221 | 2.66 % | 578,666 |
| 1995 | $5,849,467,819 | $12,350,780,310 | 3.93% | $21,910 | 2.57 % | 563,697 |
| 1994 | $5,567,553,457 | $11,883,749,942 | -0.25% | $21,623 | 2.49 % | 549,583 |