
GDP of Cameroon
| GDP nominal (2017) | GDP growth rate (2017) |
|---|---|
$34,922,782,311 |
3.55% |
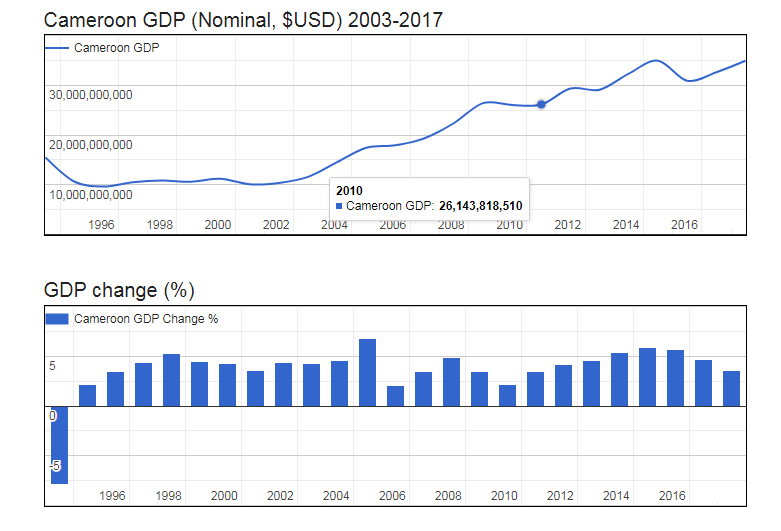
- Nominal (current) Gross Domestic Product (GDP of Cameroon is $34,922,782,311 (USD) as of 2017.
- Real GDP (constant, inflation adjusted) of Cameroon reached $36,364,818,793 in 2017.
- GDP Growth Rate in 2017 was 3.55%, representing a change of 1,246,383,919 US$ over 2016, when Real GDP was $35,118,434,874.
- GDP per Capita in Cameroon (with a population of 24,566,073 people) was $1,480 in 2017, an increase of $13 from $1,468 in 2016; this represents a change of 0.9% in GDP per capita.
Gross Domestic Product (GDP of Cameroon
| Year | GDP Nominal (Current USD) |
GDP Real (Inflation adj.) |
GDP change |
GDP per capita | Pop. change |
Population |
|---|---|---|---|---|---|---|
| 2017 | $34,922,782,311 | $36,364,818,793 | 3.55% | $1,480 | 2.67 % | 24,566,073 |
| 2016 | $32,621,535,419 | $35,118,434,874 | 4.65% | $1,468 | 2.70 % | 23,926,551 |
| 2015 | $30,916,218,544 | $33,558,475,340 | 5.65% | $1,440 | 2.72 % | 23,298,368 |
| 2014 | $34,942,948,737 | $31,763,379,465 | 5.88% | $1,400 | 2.74 % | 22,681,852 |
| 2013 | $32,348,149,947 | $29,998,263,825 | 5.40% | $1,359 | 2.76 % | 22,077,294 |
| 2012 | $29,104,437,355 | $28,460,199,047 | 4.54% | $1,325 | 2.77 % | 21,485,265 |
| 2011 | $29,337,006,833 | $27,223,369,236 | 4.13% | $1,302 | 2.78 % | 20,906,388 |
| 2010 | $26,143,818,510 | $26,143,818,510 | 3.42% | $1,285 | 2.79 % | 20,341,241 |
| 2009 | $26,017,925,552 | $25,278,654,624 | 2.20% | $1,277 | 2.79 % | 19,789,919 |
| 2008 | $26,409,781,215 | $24,734,819,037 | 3.49% | $1,285 | 2.79 % | 19,252,666 |
| 2007 | $22,365,265,026 | $23,900,962,053 | 4.90% | $1,276 | 2.78 % | 18,730,282 |
| 2006 | $19,356,046,328 | $22,784,042,335 | 3.46% | $1,250 | 2.76 % | 18,223,674 |
| 2005 | $17,944,084,201 | $22,022,574,644 | 2.02% | $1,242 | 2.75 % | 17,733,410 |
| 2004 | $17,430,933,517 | $21,586,386,665 | 6.78% | $1,251 | 2.73 % | 17,259,322 |
| 2003 | $14,548,845,765 | $20,215,577,280 | 4.57% | $1,203 | 2.71 % | 16,800,865 |
| 2002 | $11,579,343,088 | $19,332,618,830 | 4.24% | $1,182 | 2.69 % | 16,357,602 |
| 2001 | $10,371,327,756 | $18,546,755,043 | 4.37% | $1,164 | 2.67 % | 15,928,910 |
| 2000 | $10,083,937,740 | $17,770,523,602 | 3.55% | $1,145 | 2.66 % | 15,513,945 |
| 1999 | $11,198,378,749 | $17,160,738,326 | 4.29% | $1,136 | 2.64 % | 15,112,592 |
| 1998 | $10,612,847,429 | $16,454,508,052 | 4.50% | $1,118 | 2.64 % | 14,723,768 |
| 1997 | $10,833,497,458 | $15,745,595,486 | 5.23% | $1,098 | 2.67 % | 14,344,449 |
| 1996 | $10,513,387,442 | $14,962,841,271 | 4.36% | $1,071 | 2.73 % | 13,970,813 |
| 1995 | $9,643,953,175 | $14,337,567,546 | 3.47% | $1,054 | 2.79 % | 13,599,988 |
| 1994 | $10,600,157,684 | $13,856,766,549 | 2.12% | $1,047 | 2.85 % | 13,230,984 |
See also related:
- Demographics OF Oceania
- Demographics of Northern America
- Demographics OF Latin America and the Caribbean
- Demographics of Europe
- Demographics of Asia
- GDP of Barbados
- GDP of Togo
- Demographics of Africa
Sources: Cameroon GDP
- Organisation for Economic Co-operation and Development (OECD)
- World Population Prospects: The 2019 Revision – United Nations Population Division
- World Urbanization Prospects – Population Division – United Nations
- GeoNames
- United Nations Statistics Division
- World Bank