GDP of Côte d’Ivoire
| GDP nominal (2017) | GDP growth rate (2017) |
|---|---|
$37,353,276,059 |
7.70% |
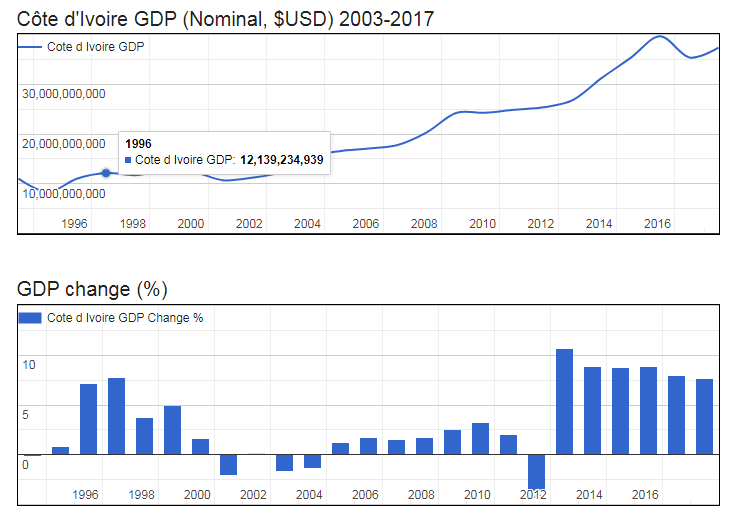
- Nominal (current) Gross Domestic Product (GDP of Côte d’Ivoire is $37,353,276,059 (USD) as of 2017.
- Real GDP (constant, inflation adjusted) of Côte d’Ivoire reached $39,495,088,685 in 2017.
- GDP Growth Rate in 2017 was 7.70%, representing a change of 2,824,408,574 US$ over 2016, when Real GDP was $36,670,680,111.
- GDP per Capita in Côte d’Ivoire (with a population of 24,437,470 people) was $1,616 in 2017, an increase of $77 from $1,539 in 2016; this represents a change of 5.0% in GDP per capita.

Gross Domestic Product (GDP of Côte d’Ivoire
| Year | GDP Nominal (Current USD) |
GDP Real (Inflation adj.) |
GDP change |
GDP per capita | Pop. change |
Population |
|---|---|---|---|---|---|---|
| 2017 | $37,353,276,059 | $39,495,088,685 | 7.70% | $1,616 | 2.58 % | 24,437,470 |
| 2016 | $35,389,998,639 | $36,670,680,111 | 7.97% | $1,539 | 2.57 % | 23,822,714 |
| 2015 | $39,633,467,836 | $33,963,218,674 | 8.84% | $1,462 | 2.55 % | 23,226,143 |
| 2014 | $35,343,298,114 | $31,203,899,802 | 8.79% | $1,378 | 2.54 % | 22,647,684 |
| 2013 | $31,273,049,200 | $28,681,616,270 | 8.89% | $1,299 | 2.51 % | 22,087,504 |
| 2012 | $26,790,579,775 | $26,340,131,050 | 10.71% | $1,222 | 2.47 % | 21,547,188 |
| 2011 | $25,381,616,734 | $23,792,758,396 | -4.39% | $1,131 | 2.41 % | 21,028,655 |
| 2010 | $24,884,505,035 | $24,884,505,035 | 2.02% | $1,212 | 2.36 % | 20,532,950 |
| 2009 | $24,277,493,862 | $24,392,355,457 | 3.25% | $1,216 | 2.31 % | 20,059,147 |
| 2008 | $24,224,903,100 | $23,624,224,724 | 2.54% | $1,205 | 2.27 % | 19,605,569 |
| 2007 | $20,343,635,320 | $23,038,394,864 | 1.77% | $1,202 | 2.22 % | 19,171,237 |
| 2006 | $17,800,887,796 | $22,638,811,513 | 1.52% | $1,207 | 2.18 % | 18,754,916 |
| 2005 | $17,084,928,927 | $22,300,767,039 | 1.72% | $1,215 | 2.14 % | 18,354,514 |
| 2004 | $16,554,441,847 | $21,923,410,906 | 1.23% | $1,220 | 2.11 % | 17,970,494 |
| 2003 | $15,306,602,560 | $21,656,650,171 | -1.36% | $1,231 | 2.14 % | 17,599,610 |
| 2002 | $12,346,919,216 | $21,955,138,166 | -1.67% | $1,274 | 2.25 % | 17,231,539 |
| 2001 | $11,192,560,827 | $22,327,480,641 | 0.12% | $1,325 | 2.42 % | 16,853,026 |
| 2000 | $10,717,022,463 | $22,300,414,202 | -2.07% | $1,355 | 2.63 % | 16,454,668 |
| 1999 | $12,376,639,823 | $22,771,418,229 | 1.62% | $1,420 | 2.84 % | 16,032,573 |
| 1998 | $12,612,033,729 | $22,408,947,356 | 4.93% | $1,437 | 3.03 % | 15,589,414 |
| 1997 | $11,722,142,706 | $21,355,953,698 | 3.74% | $1,411 | 3.17 % | 15,130,663 |
| 1996 | $12,139,234,939 | $20,585,330,896 | 7.73% | $1,404 | 3.28 % | 14,665,127 |
| 1995 | $11,000,146,839 | $19,108,381,523 | 7.13% | $1,346 | 3.38 % | 14,199,762 |
| 1994 | $8,313,557,450 | $17,837,338,328 | 0.81% | $1,299 | 3.49 % | 13,735,433 |