GDP of India
| GDP nominal (2017) | GDP growth rate (2017) |
|---|---|
$2,650,725,335,364 |
6.68% |
- Nominal (current) Gross Domestic Product GDP of India is $2,650,725,335,364 (USD) as of 2017.
- Real GDP (constant, inflation adjusted) of India reached $2,660,371,703,953 in 2017.
- GDP Growth Rate in 2017 was 6.68%, representing a change of 177,938,082,996 US$ over 2016, when Real GDP was $2,482,433,620,957.
- GDP per Capita in India (with a population of 1,338,676,785 people) was $1,987 in 2017, an increase of $113 from $1,874 in 2016; this represents a change of 6.0% in GDP per capita.

India Gross Domestic Product GDP of India
| Year | GDP Nominal (Current USD) |
GDP Real (Inflation adj.) |
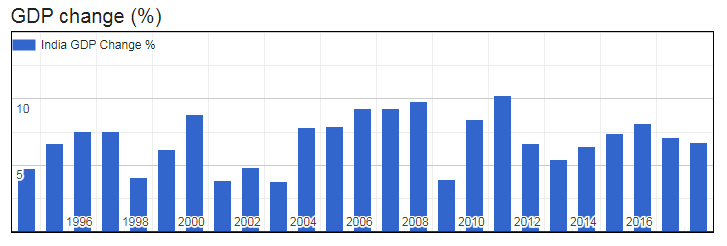
GDP change |
GDP per capita | Pop. change |
Population |
|---|---|---|---|---|---|---|
| 2017 | $2,650,725,335,364 | $2,660,371,703,953 | 6.68% | $1,987 | 1.07 % | 1,338,676,785 |
| 2016 | $2,290,432,075,124 | $2,482,433,620,957 | 7.11% | $1,874 | 1.10 % | 1,324,517,249 |
| 2015 | $2,103,587,813,812 | $2,294,947,293,526 | 8.15% | $1,752 | 1.12 % | 1,310,152,403 |
| 2014 | $2,039,127,446,299 | $2,125,024,908,809 | 7.41% | $1,640 | 1.15 % | 1,295,600,772 |
| 2013 | $1,856,722,121,394 | $1,978,419,519,434 | 6.39% | $1,545 | 1.19 % | 1,280,842,125 |
| 2012 | $1,827,637,859,136 | $1,859,659,673,960 | 5.46% | $1,469 | 1.24 % | 1,265,780,247 |
| 2011 | $1,823,049,927,772 | $1,763,439,576,431 | 6.64% | $1,410 | 1.30 % | 1,250,287,943 |
| 2010 | $1,675,615,312,693 | $1,675,615,312,693 | 10.26% | $1,358 | 1.36 % | 1,234,281,170 |
| 2009 | $1,341,886,699,393 | $1,544,380,258,529 | 8.48% | $1,268 | 1.42 % | 1,217,726,215 |
| 2008 | $1,198,895,498,504 | $1,431,812,818,925 | 3.89% | $1,193 | 1.48 % | 1,200,669,765 |
| 2007 | $1,216,735,426,855 | $1,388,940,404,163 | 9.80% | $1,174 | 1.52 % | 1,183,209,472 |
| 2006 | $940,259,892,375 | $1,290,107,534,501 | 9.26% | $1,107 | 1.56 % | 1,165,486,291 |
| 2005 | $820,381,672,148 | $1,193,872,693,289 | 9.28% | $1,040 | 1.59 % | 1,147,609,927 |
| 2004 | $709,148,531,775 | $1,106,221,983,522 | 7.92% | $979 | 1.63 % | 1,129,623,456 |
| 2003 | $607,699,299,977 | $1,025,010,946,219 | 7.86% | $922 | 1.67 % | 1,111,523,144 |
| 2002 | $514,937,961,194 | $950,312,739,671 | 3.80% | $869 | 1.70 % | 1,093,317,189 |
| 2001 | $485,441,026,156 | $915,487,809,335 | 4.82% | $852 | 1.74 % | 1,075,000,085 |
| 2000 | $468,394,948,472 | $873,357,345,618 | 3.84% | $827 | 1.78 % | 1,056,575,549 |
| 1999 | $458,820,428,318 | $841,052,590,011 | 8.85% | $810 | 1.82 % | 1,038,058,156 |
| 1998 | $421,351,487,589 | $772,701,320,024 | 6.18% | $758 | 1.86 % | 1,019,483,581 |
| 1997 | $415,867,763,817 | $727,697,481,831 | 4.05% | $727 | 1.89 % | 1,000,900,030 |
| 1996 | $392,897,063,751 | $699,374,084,350 | 7.55% | $712 | 1.91 % | 982,365,243 |
| 1995 | $360,281,961,339 | $650,280,977,289 | 7.57% | $675 | 1.94 % | 963,922,588 |
| 1994 | $327,275,591,370 | $604,493,654,736 | 6.66% | $639 | 1.96 % | 945,601,831 |