
10 Surprising Facts About The GDP of Luxembourg: A Comprehensive Guide
- Luxembourg has the highest GDP per capita in the world, making it the wealthiest country based on this economic indicator. As of 2021, its GDP per capita was over $120,000 USD, according to the International Monetary Fund (IMF).
- Despite being a small country with a population of just over 600,000, Luxembourg has a robust economy driven by its financial sector. In fact, the financial industry accounts for a significant portion of its GDP, with Luxembourg being one of the world’s leading global financial centers.
- The GDP of Luxembourg has been steadily growing over the past decade, with an average annual growth rate of around 3% in recent years. This is primarily attributed to its favorable business environment, political stability, and skilled workforce.
- Luxembourg has a unique economic model that heavily relies on cross-border commuting. Around 200,000 workers commute to Luxembourg from neighboring countries such as Belgium, France, and Germany, making up a significant portion of the country’s workforce and contributing to its GDP.
- The steel industry played a significant role in Luxembourg’s economic growth in the past, with the country being one of the world’s largest steel producers in the mid-20th century. However, over the years, the economy has shifted towards the financial and service sectors, diversifying its GDP composition.
- Luxembourg is known for its favorable tax policies, which have attracted numerous multinational corporations to establish their headquarters or regional offices in the country. This has contributed to the growth of its financial sector and overall GDP.
- Luxembourg has a high level of economic inequality, with a significant wealth gap between its residents. Despite its high GDP per capita, there are income disparities, and the country has been taking steps to address this issue through social policies and initiatives.
- Luxembourg has a strong focus on sustainability and renewable energy. It has set ambitious targets to reduce greenhouse gas emissions, increase renewable energy production, and promote environmentally friendly policies, which are expected to have a positive impact on its GDP in the long term.
- Luxembourg is a major hub for the investment fund industry, with a large number of global asset managers and investment funds having a presence in the country. This has led to Luxembourg being one of the world’s largest domiciles for investment funds, contributing significantly to its GDP.
- Luxembourg has a relatively small agricultural sector, with only a small percentage of its GDP coming from agriculture. The country relies heavily on imports for its food supply, as its limited land resources are primarily used for other economic activities such as finance and services.
GDP of Luxembourg
| GDP nominal (2017) | GDP growth rate (2017) |
|---|---|
$62,316,359,824 |
2.30% |
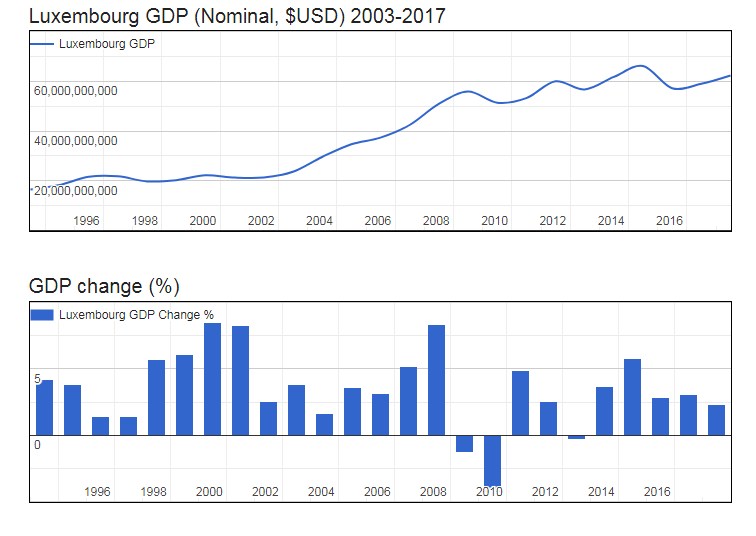
- Nominal (current) Gross Domestic Product (GDP) of Luxembourg is $62,316,359,824 (USD) as of 2017.
- Real GDP (constant, inflation adjusted) of Luxembourg reached $63,521,461,701 in 2017.
- GDP Growth Rate in 2017 was 2.30%, representing a change of 966,881,506 US$ over 2016, when Real GDP was $62,554,580,195.
- GDP per Capita in Luxembourg (with a population of 591,910 people) was $107,316 in 2017, a decrease of $674 from $107,990 in 2016; this represents a change of -0.6% in GDP per capita.
Gross Domestic Product (GDP of Luxembourg
| Year | GDP Nominal (Current USD) |
GDP Real (Inflation adj.) |
GDP change |
GDP per capita | Pop. change |
Population |
|---|---|---|---|---|---|---|
| 2017 | $62,316,359,824 | $63,521,461,701 | 2.30% | $107,316 | 2.18 % | 591,910 |
| 2016 | $58,961,235,412 | $62,554,580,195 | 3.08% | $107,990 | 2.21 % | 579,264 |
| 2015 | $57,204,400,105 | $61,081,638,753 | 2.86% | $107,777 | 2.20 % | 566,741 |
| 2014 | $66,103,853,237 | $58,779,842,025 | 5.77% | $106,002 | 2.20 % | 554,516 |
| 2013 | $61,739,352,212 | $56,358,248,456 | 3.65% | $103,875 | 2.20 % | 542,560 |
| 2012 | $56,677,961,787 | $54,371,319,074 | -0.35% | $102,422 | 2.22 % | 530,857 |
| 2011 | $60,004,630,234 | $54,563,666,562 | 2.54% | $105,070 | 2.25 % | 519,307 |
| 2010 | $53,212,476,812 | $53,212,476,812 | 4.86% | $104,772 | 2.29 % | 507,889 |
| 2009 | $51,370,543,206 | $50,743,806,576 | -4.36% | $102,197 | 2.29 % | 496,527 |
| 2008 | $55,849,686,539 | $53,056,323,196 | -1.28% | $109,303 | 2.21 % | 485,405 |
| 2007 | $50,888,134,410 | $53,744,023,972 | 8.35% | $113,166 | 2.00 % | 474,915 |
| 2006 | $42,414,308,117 | $49,600,152,814 | 5.18% | $106,527 | 1.70 % | 465,610 |
| 2005 | $37,347,394,603 | $47,158,078,345 | 3.17% | $103,001 | 1.33 % | 457,842 |
| 2004 | $34,685,281,848 | $45,708,017,660 | 3.61% | $101,164 | 1.01 % | 451,819 |
| 2003 | $29,557,325,056 | $44,114,523,132 | 1.63% | $98,619 | 0.81 % | 447,322 |
| 2002 | $23,616,328,816 | $43,407,293,716 | 3.82% | $97,825 | 0.80 % | 443,726 |
| 2001 | $21,272,418,792 | $41,810,359,657 | 2.53% | $94,981 | 0.94 % | 440,198 |
| 2000 | $21,263,514,833 | $40,777,874,110 | 8.24% | $93,505 | 1.12 % | 436,103 |
| 1999 | $22,235,929,043 | $37,673,641,715 | 8.48% | $87,357 | 1.27 % | 431,262 |
| 1998 | $20,209,122,027 | $34,728,330,983 | 6.04% | $81,554 | 1.40 % | 425,833 |
| 1997 | $19,731,912,494 | $32,748,781,294 | 5.71% | $77,978 | 1.44 % | 419,974 |
| 1996 | $21,776,609,772 | $30,979,915,750 | 1.39% | $74,831 | 1.43 % | 413,999 |
| 1995 | $21,588,170,498 | $30,555,672,135 | 1.43% | $74,864 | 1.42 % | 408,149 |
| 1994 | $18,325,791,415 | $30,124,232,789 | 3.82% | $74,855 | 1.42 % | 402,433 |
See also
- Demographics OF Oceania
- Demographics of Northern America
- Demographics OF Latin America and the Caribbean
- Demographics of Europe
- Demographics of Asia
- GDP of Barbados
- GDP of Togo
- Demographics of Africa
Sources: GDP of Luxembourg
- Organisation for Economic Co-operation and Development (OECD)
- World Population Prospects: The 2019 Revision – United Nations Population Division
- World Urbanization Prospects – Population Division – United Nations
- GeoNames
- United Nations Statistics Division
- World Bank