GDP of Togo
| GDP nominal (2017) | GDP growth rate (2017) |
|---|---|
$4,757,776,485 |
4.40% |
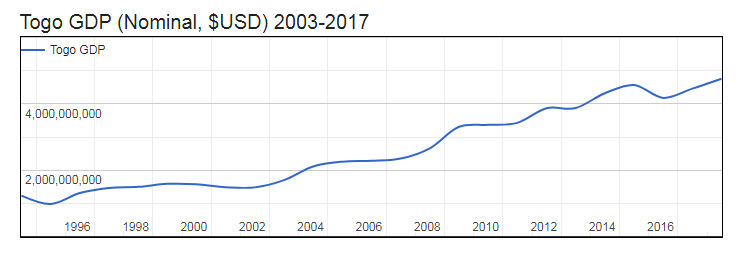
- Nominal (current) Gross Domestic Product (GDP) of Togo is $4,757,776,485 (USD) as of 2017.
- Real GDP (constant, inflation adjusted) of Togo reached $5,064,680,352 in 2017.
- GDP Growth Rate in 2017 was 4.40%, representing a change of 213,454,448 US$ over 2016, when Real GDP was $4,851,225,904.
- GDP per Capita in Togo (with a population of 7,698,474 people) was $658 in 2017, an increase of $12 from $646 in 2016; this represents a change of 1.8% in GDP per capita.

Gross Domestic Product (GDP of Togo
| Year | GDP Nominal (Current USD) |
GDP Real (Inflation adj.) |
GDP change |
GDP per capita | Pop. change |
Population |
|---|---|---|---|---|---|---|
| 2017 | $4,757,776,485 | $5,064,680,352 | 4.40% | $658 | 2.51 % | 7,698,474 |
| 2016 | $4,457,732,625 | $4,851,225,904 | 5.10% | $646 | 2.55 % | 7,509,951 |
| 2015 | $4,179,185,205 | $4,615,819,478 | 5.74% | $630 | 2.59 % | 7,323,158 |
| 2014 | $4,568,900,620 | $4,365,135,489 | 5.92% | $612 | 2.64 % | 7,138,000 |
| 2013 | $4,320,427,496 | $4,121,139,759 | 6.11% | $593 | 2.67 % | 6,954,722 |
| 2012 | $3,873,529,926 | $3,883,751,541 | 6.54% | $573 | 2.70 % | 6,773,809 |
| 2011 | $3,867,391,618 | $3,645,225,926 | 6.40% | $553 | 2.71 % | 6,595,943 |
| 2010 | $3,426,022,206 | $3,426,022,206 | 6.10% | $534 | 2.73 % | 6,421,679 |
| 2009 | $3,365,711,796 | $3,229,072,694 | 5.54% | $517 | 2.75 % | 6,250,835 |
| 2008 | $3,310,277,927 | $3,059,632,945 | 4.06% | $503 | 2.75 % | 6,083,420 |
| 2007 | $2,659,095,101 | $2,940,194,799 | 2.29% | $497 | 2.73 % | 5,920,359 |
| 2006 | $2,349,495,621 | $2,874,358,933 | 4.05% | $499 | 2.70 % | 5,762,880 |
| 2005 | $2,280,575,830 | $2,762,414,501 | 1.18% | $492 | 2.63 % | 5,611,640 |
| 2004 | $2,255,942,249 | $2,730,187,182 | 2.12% | $499 | 2.57 % | 5,467,766 |
| 2003 | $2,111,093,198 | $2,673,533,266 | 4.95% | $502 | 2.57 % | 5,330,639 |
| 2002 | $1,698,678,686 | $2,547,328,483 | -0.92% | $490 | 2.66 % | 5,197,031 |
| 2001 | $1,481,141,850 | $2,571,037,330 | -1.63% | $508 | 2.81 % | 5,062,567 |
| 2000 | $1,488,185,772 | $2,613,554,803 | -0.78% | $531 | 3.01 % | 4,924,402 |
| 1999 | $1,576,094,566 | $2,634,193,169 | 2.48% | $551 | 3.19 % | 4,780,448 |
| 1998 | $1,587,345,951 | $2,570,402,177 | -2.30% | $555 | 3.27 % | 4,632,446 |
| 1997 | $1,498,950,899 | $2,630,909,856 | 14.38% | $586 | 3.15 % | 4,485,951 |
| 1996 | $1,465,448,290 | $2,300,201,239 | 8.84% | $529 | 2.90 % | 4,348,805 |
| 1995 | $1,309,382,885 | $2,113,452,135 | 7.85% | $500 | 2.56 % | 4,226,291 |
| 1994 | $982,624,325 | $1,959,697,552 | 14.98% | $476 | 2.27 % | 4,120,616 |