GDP of Mauritania
| GDP nominal (2017) | GDP growth rate (2017) |
|---|---|
$5,024,708,656 |
3.50% |
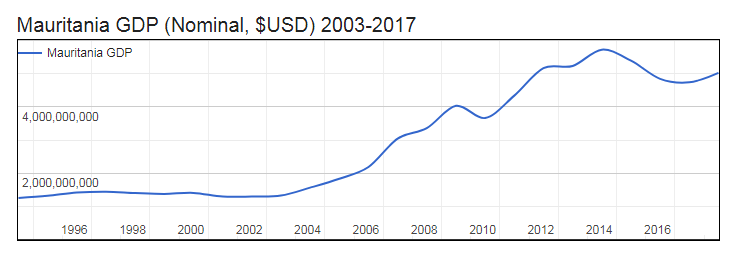
- Nominal (current) Gross Domestic Product (GDP) of Mauritania is $5,024,708,656 (USD) as of 2017.
- Real GDP (constant, inflation adjusted) of Mauritania reached $5,761,444,777 in 2017.
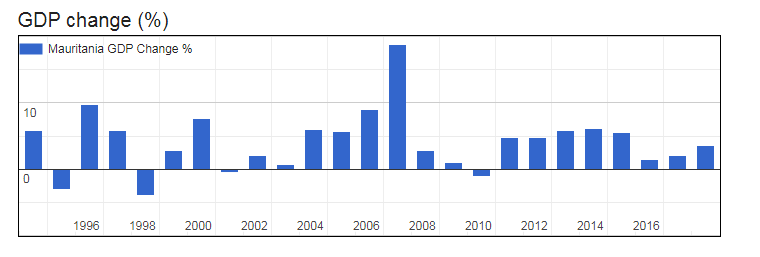
- GDP Growth Rate in 2017 was 3.50%, representing a change of 194,831,466 US$ over 2016, when Real GDP was $5,566,613,311.
- GDP per Capita in Mauritania (with a population of 4,282,570 people) was $1,345 in 2017, an increase of $8 from $1,337 in 2016; this represents a change of 0.6% in GDP per capita.
Gross Domestic Product (GDP) of Mauritania
| Year | GDP Nominal (Current USD) |
GDP Real (Inflation adj.) |
GDP change |
GDP per capita | Pop. change |
Population |
|---|---|---|---|---|---|---|
| 2017 | $5,024,708,656 | $5,761,444,777 | 3.50% | $1,345 | 2.86 % | 4,282,570 |
| 2016 | $4,739,298,730 | $5,566,613,311 | 2.00% | $1,337 | 2.90 % | 4,163,533 |
| 2015 | $4,844,223,107 | $5,457,464,031 | 1.40% | $1,349 | 2.94 % | 4,046,301 |
| 2014 | $5,391,475,277 | $5,382,114,429 | 5.58% | $1,369 | 2.97 % | 3,930,896 |
| 2013 | $5,724,227,185 | $5,097,686,760 | 6.09% | $1,335 | 2.99 % | 3,817,494 |
| 2012 | $5,231,255,478 | $4,805,046,968 | 5.80% | $1,296 | 3.00 % | 3,706,555 |
| 2011 | $5,166,341,003 | $4,541,843,582 | 4.70% | $1,262 | 2.99 % | 3,598,648 |
| 2010 | $4,337,791,007 | $4,337,791,007 | 4.77% | $1,241 | 2.97 % | 3,494,195 |
| 2009 | $3,662,282,133 | $4,140,152,656 | -1.04% | $1,220 | 2.95 % | 3,393,409 |
| 2008 | $4,031,048,268 | $4,183,750,758 | 1.08% | $1,269 | 2.93 % | 3,296,238 |
| 2007 | $3,356,757,064 | $4,139,050,373 | 2.82% | $1,292 | 2.91 % | 3,202,517 |
| 2006 | $3,040,716,679 | $4,025,615,110 | 18.87% | $1,294 | 2.90 % | 3,111,906 |
| 2005 | $2,184,445,123 | $3,386,595,114 | 8.97% | $1,120 | 2.89 % | 3,024,194 |
| 2004 | $1,833,444,740 | $3,107,839,834 | 5.75% | $1,057 | 2.87 % | 2,939,247 |
| 2003 | $1,563,074,860 | $2,938,927,238 | 5.98% | $1,029 | 2.85 % | 2,857,148 |
| 2002 | $1,324,426,607 | $2,773,141,796 | 0.67% | $998 | 2.80 % | 2,778,099 |
| 2001 | $1,295,539,448 | $2,754,822,114 | 2.01% | $1,019 | 2.74 % | 2,702,400 |
| 2000 | $1,293,654,175 | $2,700,573,085 | -0.43% | $1,027 | 2.68 % | 2,630,219 |
| 1999 | $1,405,662,879 | $2,712,246,765 | 7.71% | $1,059 | 2.62 % | 2,561,585 |
| 1998 | $1,375,115,534 | $2,518,035,113 | 2.78% | $1,009 | 2.57 % | 2,496,216 |
| 1997 | $1,401,946,853 | $2,449,979,463 | -4.04% | $1,007 | 2.56 % | 2,433,563 |
| 1996 | $1,442,598,431 | $2,553,250,708 | 5.82% | $1,076 | 2.56 % | 2,372,901 |
| 1995 | $1,415,296,704 | $2,412,851,087 | 9.82% | $1,043 | 2.58 % | 2,313,630 |
| 1994 | $1,315,932,645 | $2,197,100,229 | -3.06% | $974 | 2.59 % | 2,255,516 |