
Kenya GDP
| GDP nominal (2017) | GDP growth rate (2017) |
|---|---|
$79,263,075,749 |
4.87% |
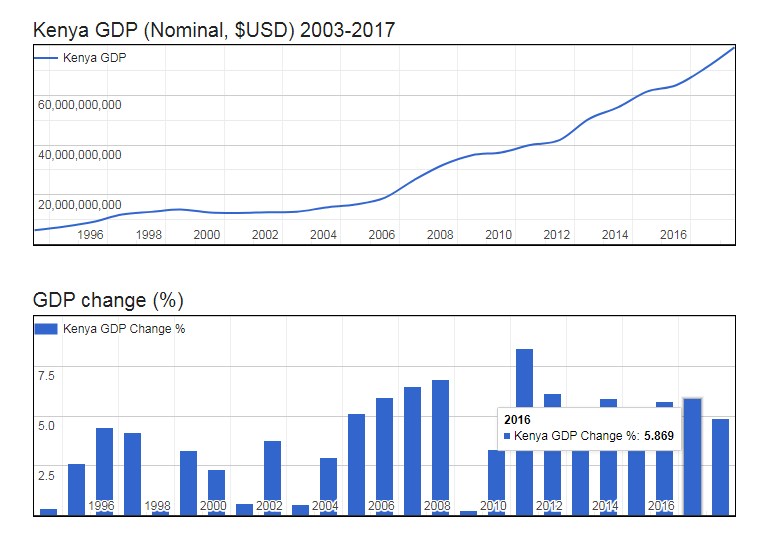
- Nominal (current) Gross Domestic Product (Kenya GDP is $79,263,075,749 (USD) as of 2017.
- Real GDP (constant, inflation adjusted) of Kenya reached $58,109,837,754 in 2017.
- GDP Growth Rate in 2017 was 4.87%, representing a change of 2,700,610,686 US$ over 2016, when Real GDP was $55,409,227,068.
- GDP per Capita in Kenya (with a population of 50,221,142 people) was $1,157 in 2017, an increase of $27 from $1,130 in 2016; this represents a change of 2.4% in GDP per capita.
Gross Domestic Product (Kenya GDP
| Year | GDP Nominal (Current USD) |
GDP Real (Inflation adj.) |
GDP change |
GDP per capita | Pop. change |
Population |
|---|---|---|---|---|---|---|
| 2017 | $79,263,075,749 | $58,109,837,754 | 4.87% | $1,157 | 2.38 % | 50,221,142 |
| 2016 | $70,875,223,143 | $55,409,227,068 | 5.87% | $1,130 | 2.45 % | 49,051,534 |
| 2015 | $64,007,751,188 | $52,337,439,286 | 5.72% | $1,093 | 2.52 % | 47,878,336 |
| 2014 | $61,448,041,564 | $49,506,419,900 | 5.36% | $1,060 | 2.59 % | 46,700,055 |
| 2013 | $55,096,728,048 | $46,989,149,335 | 5.88% | $1,032 | 2.65 % | 45,519,981 |
| 2012 | $50,412,754,861 | $44,380,180,300 | 4.56% | $1,001 | 2.70 % | 44,343,467 |
| 2011 | $41,953,433,591 | $42,443,399,231 | 6.11% | $983 | 2.73 % | 43,178,274 |
| 2010 | $40,000,088,347 | $40,000,088,347 | 8.41% | $952 | 2.76 % | 42,030,676 |
| 2009 | $37,021,512,049 | $36,898,510,533 | 3.31% | $902 | 2.79 % | 40,901,792 |
| 2008 | $35,895,153,328 | $35,717,358,968 | 0.23% | $898 | 2.81 % | 39,791,981 |
| 2007 | $31,958,195,182 | $35,634,585,974 | 6.85% | $921 | 2.81 % | 38,705,932 |
| 2006 | $25,825,524,821 | $33,349,876,084 | 6.47% | $886 | 2.80 % | 37,649,033 |
| 2005 | $18,737,897,745 | $31,322,527,291 | 5.91% | $855 | 2.78 % | 36,624,895 |
| 2004 | $16,095,337,094 | $29,575,595,617 | 5.10% | $830 | 2.76 % | 35,635,271 |
| 2003 | $14,904,517,650 | $28,139,282,294 | 2.93% | $811 | 2.75 % | 34,678,779 |
| 2002 | $13,147,743,911 | $27,337,613,464 | 0.55% | $810 | 2.75 % | 33,751,739 |
| 2001 | $12,986,007,426 | $27,188,928,219 | 3.78% | $828 | 2.77 % | 32,848,564 |
| 2000 | $12,705,357,103 | $26,198,643,973 | 0.60% | $820 | 2.78 % | 31,964,557 |
| 1999 | $12,896,013,577 | $26,042,468,490 | 2.31% | $837 | 2.80 % | 31,098,757 |
| 1998 | $14,093,998,844 | $25,455,617,585 | 3.29% | $841 | 2.84 % | 30,250,488 |
| 1997 | $13,115,773,738 | $24,644,752,554 | 0.47% | $838 | 2.89 % | 29,415,659 |
| 1996 | $12,045,858,436 | $24,528,267,342 | 4.15% | $858 | 2.96 % | 28,589,451 |
| 1995 | $9,046,326,060 | $23,551,619,535 | 4.41% | $848 | 3.03 % | 27,768,296 |
| 1994 | $7,148,145,376 | $22,557,679,340 | 2.63% | $837 | 3.12 % | 26,950,513 |
See also
- Demographics OF Oceania
- Demographics of Northern America
- Demographics OF Latin America and the Caribbean
- Demographics of Europe
- Demographics of Asia
- GDP of Barbados
- GDP of Togo
- Demographics of Africa
Sources:
- Organisation for Economic Co-operation and Development (OECD)
- World Population Prospects: The 2019 Revision – United Nations Population Division
- World Urbanization Prospects – Population Division – United Nations
- GeoNames
- United Nations Statistics Division
- World Bank