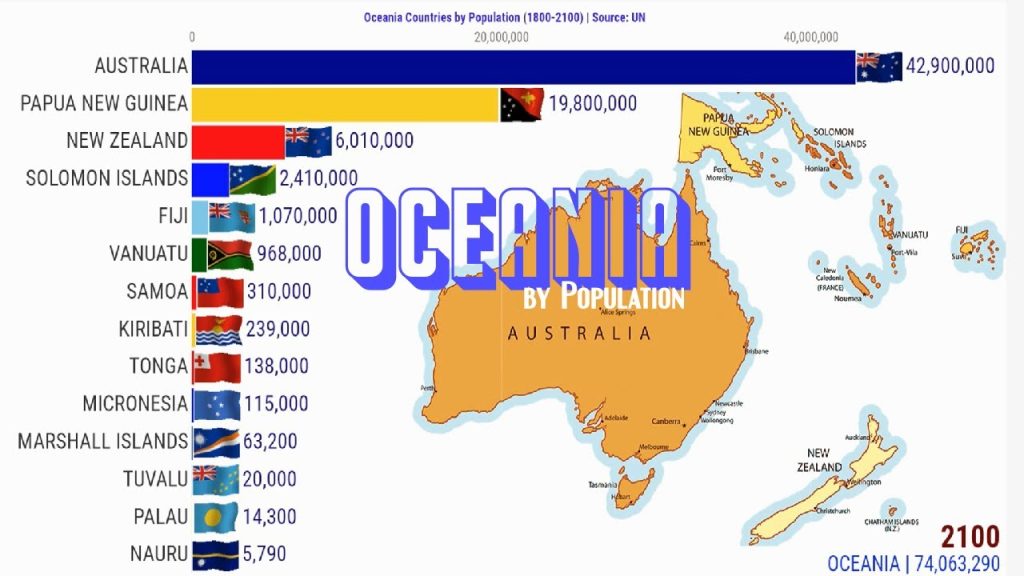
Population of Oceania Countries 2024
To access an assortment of information regarding present-day approximations, past statistics, listings of nations, and potential numerical representations, direct your cursor toward the designated country and click.

| # | Country (or dependency) | Population (2020) |
Yearly Change |
Net Change |
Density (P/Km²) |
Land Area (Km²) |
Migrants (net) |
Fert. Rate |
Med. Age |
Urban Pop % |
World Share |
|---|---|---|---|---|---|---|---|---|---|---|---|
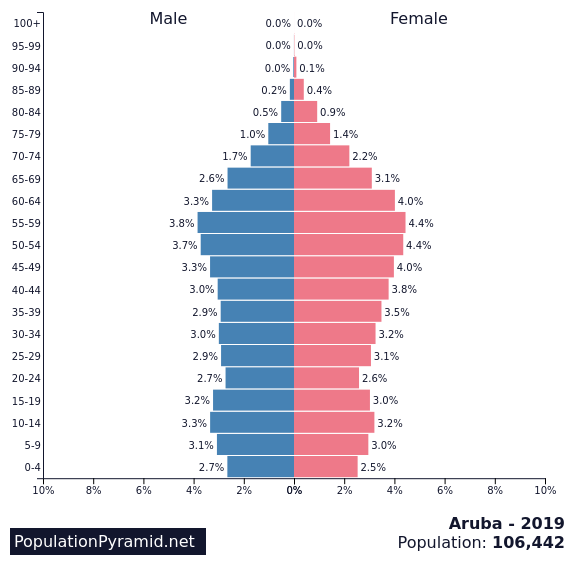
| 1 | Australia | 25,499,884 | 1.18 % | 296,686 | 3 | 7,682,300 | 158,246 | 1.8 | 38 | 86 % | 0.33 % |
| 2 | Papua New Guinea | 8,947,024 | 1.95 % | 170,915 | 20 | 452,860 | -800 | 3.6 | 22 | 13 % | 0.11 % |
| 3 | New Zealand | 4,822,233 | 0.82 % | 39,170 | 18 | 263,310 | 14,881 | 1.9 | 38 | 87 % | 0.06 % |
| 4 | Fiji | 896,445 | 0.73 % | 6,492 | 49 | 18,270 | -6,202 | 2.8 | 28 | 59 % | 0.01 % |
| 5 | Solomon Islands | 686,884 | 2.55 % | 17,061 | 25 | 27,990 | -1,600 | 4.4 | 20 | 23 % | 0.01 % |
| 6 | Micronesia | 548,914 | 1.00 % | 5,428 | 784 | 700 | -2,957 | 2.9 | 27 | 68 % | 0.01 % |
| 7 | Vanuatu | 307,145 | 2.42 % | 7,263 | 25 | 12,190 | 120 | 3.8 | 21 | 24 % | 0.00 % |
| 8 | New Caledonia | 285,498 | 0.97 % | 2,748 | 16 | 18,280 | 502 | 2.0 | 34 | 72 % | 0.00 % |
| 9 | French Polynesia | 280,908 | 0.58 % | 1,621 | 77 | 3,660 | -1,000 | 2.0 | 34 | 64 % | 0.00 % |
| 10 | Samoa | 198,414 | 0.67 % | 1,317 | 70 | 2,830 | -2,803 | 3.9 | 22 | 18 % | 0.00 % |
| 11 | Guam | 168,775 | 0.89 % | 1,481 | 313 | 540 | -506 | 2.3 | 31 | 95 % | 0.00 % |
| 12 | Kiribati | 119,449 | 1.57 % | 1,843 | 147 | 810 | -800 | 3.6 | 23 | 57 % | 0.00 % |
| 13 | Tonga | 105,695 | 1.15 % | 1,201 | 147 | 720 | -800 | 3.6 | 22 | 24 % | 0.00 % |
| 14 | Marshall Islands | 59,190 | 0.68 % | 399 | 329 | 180 | N.A. | N.A. | 70 % | 0.00 % | |
| 15 | Northern Mariana Islands | 57,559 | 0.60 % | 343 | 125 | 460 | N.A. | N.A. | 88 % | 0.00 % | |
| 16 | American Samoa | 55,191 | -0.22 % | -121 | 276 | 200 | N.A. | N.A. | 88 % | 0.00 % | |
| 17 | Palau | 18,094 | 0.48 % | 86 | 39 | 460 | N.A. | N.A. | N.A. | 0.00 % | |
| 18 | Cook Islands | 17,564 | 0.09 % | 16 | 73 | 240 | N.A. | N.A. | 75 % | 0.00 % | |
| 19 | Tuvalu | 11,792 | 1.25 % | 146 | 393 | 30 | N.A. | N.A. | 62 % | 0.00 % | |
| 20 | Wallis & Futuna | 11,239 | -1.69 % | -193 | 80 | 140 | N.A. | N.A. | 0 % | 0.00 % | |
| 21 | Nauru | 10,824 | 0.63 % | 68 | 541 | 20 | N.A. | N.A. | N.A. | 0.00 % | |
| 22 | Niue | 1,626 | 0.68 % | 11 | 6 | 260 | N.A. | N.A. | 46 % | 0.00 % | |
| 23 | Tokelau | 1,357 | 1.27 % | 17 | 136 | 10 | N.A. | N.A. | 0 % | 0.00 % |
Source: The United Nations Department of Economic and Social Affairs, Population Division provided an in-depth analysis of data in their report titled “World Population Prospects: The 2019 Revision” using the medium-fertility variant.
See also related: Population of Oceania Countries
- Population of Algeria
- GDP (Gross Domestic Product) of Algeria
- Demographics of Africa
- World Demographics
- Demographics
- Population
Related Topics: Population of Oceania Countries
Sources: Population of Oceania Countries
- GeoNames
- World Population Prospects: The 2019 Revision – United Nations Population Division
- Organisation for Economic Co-operation and Development (OECD)
- World Urbanization Prospects – Population Division – United Nations
- United Nations Statistics Division
- World Bank